
Hi all,
Here's a guide to a player's Performance Dashboards to help you understand what the data is telling you.
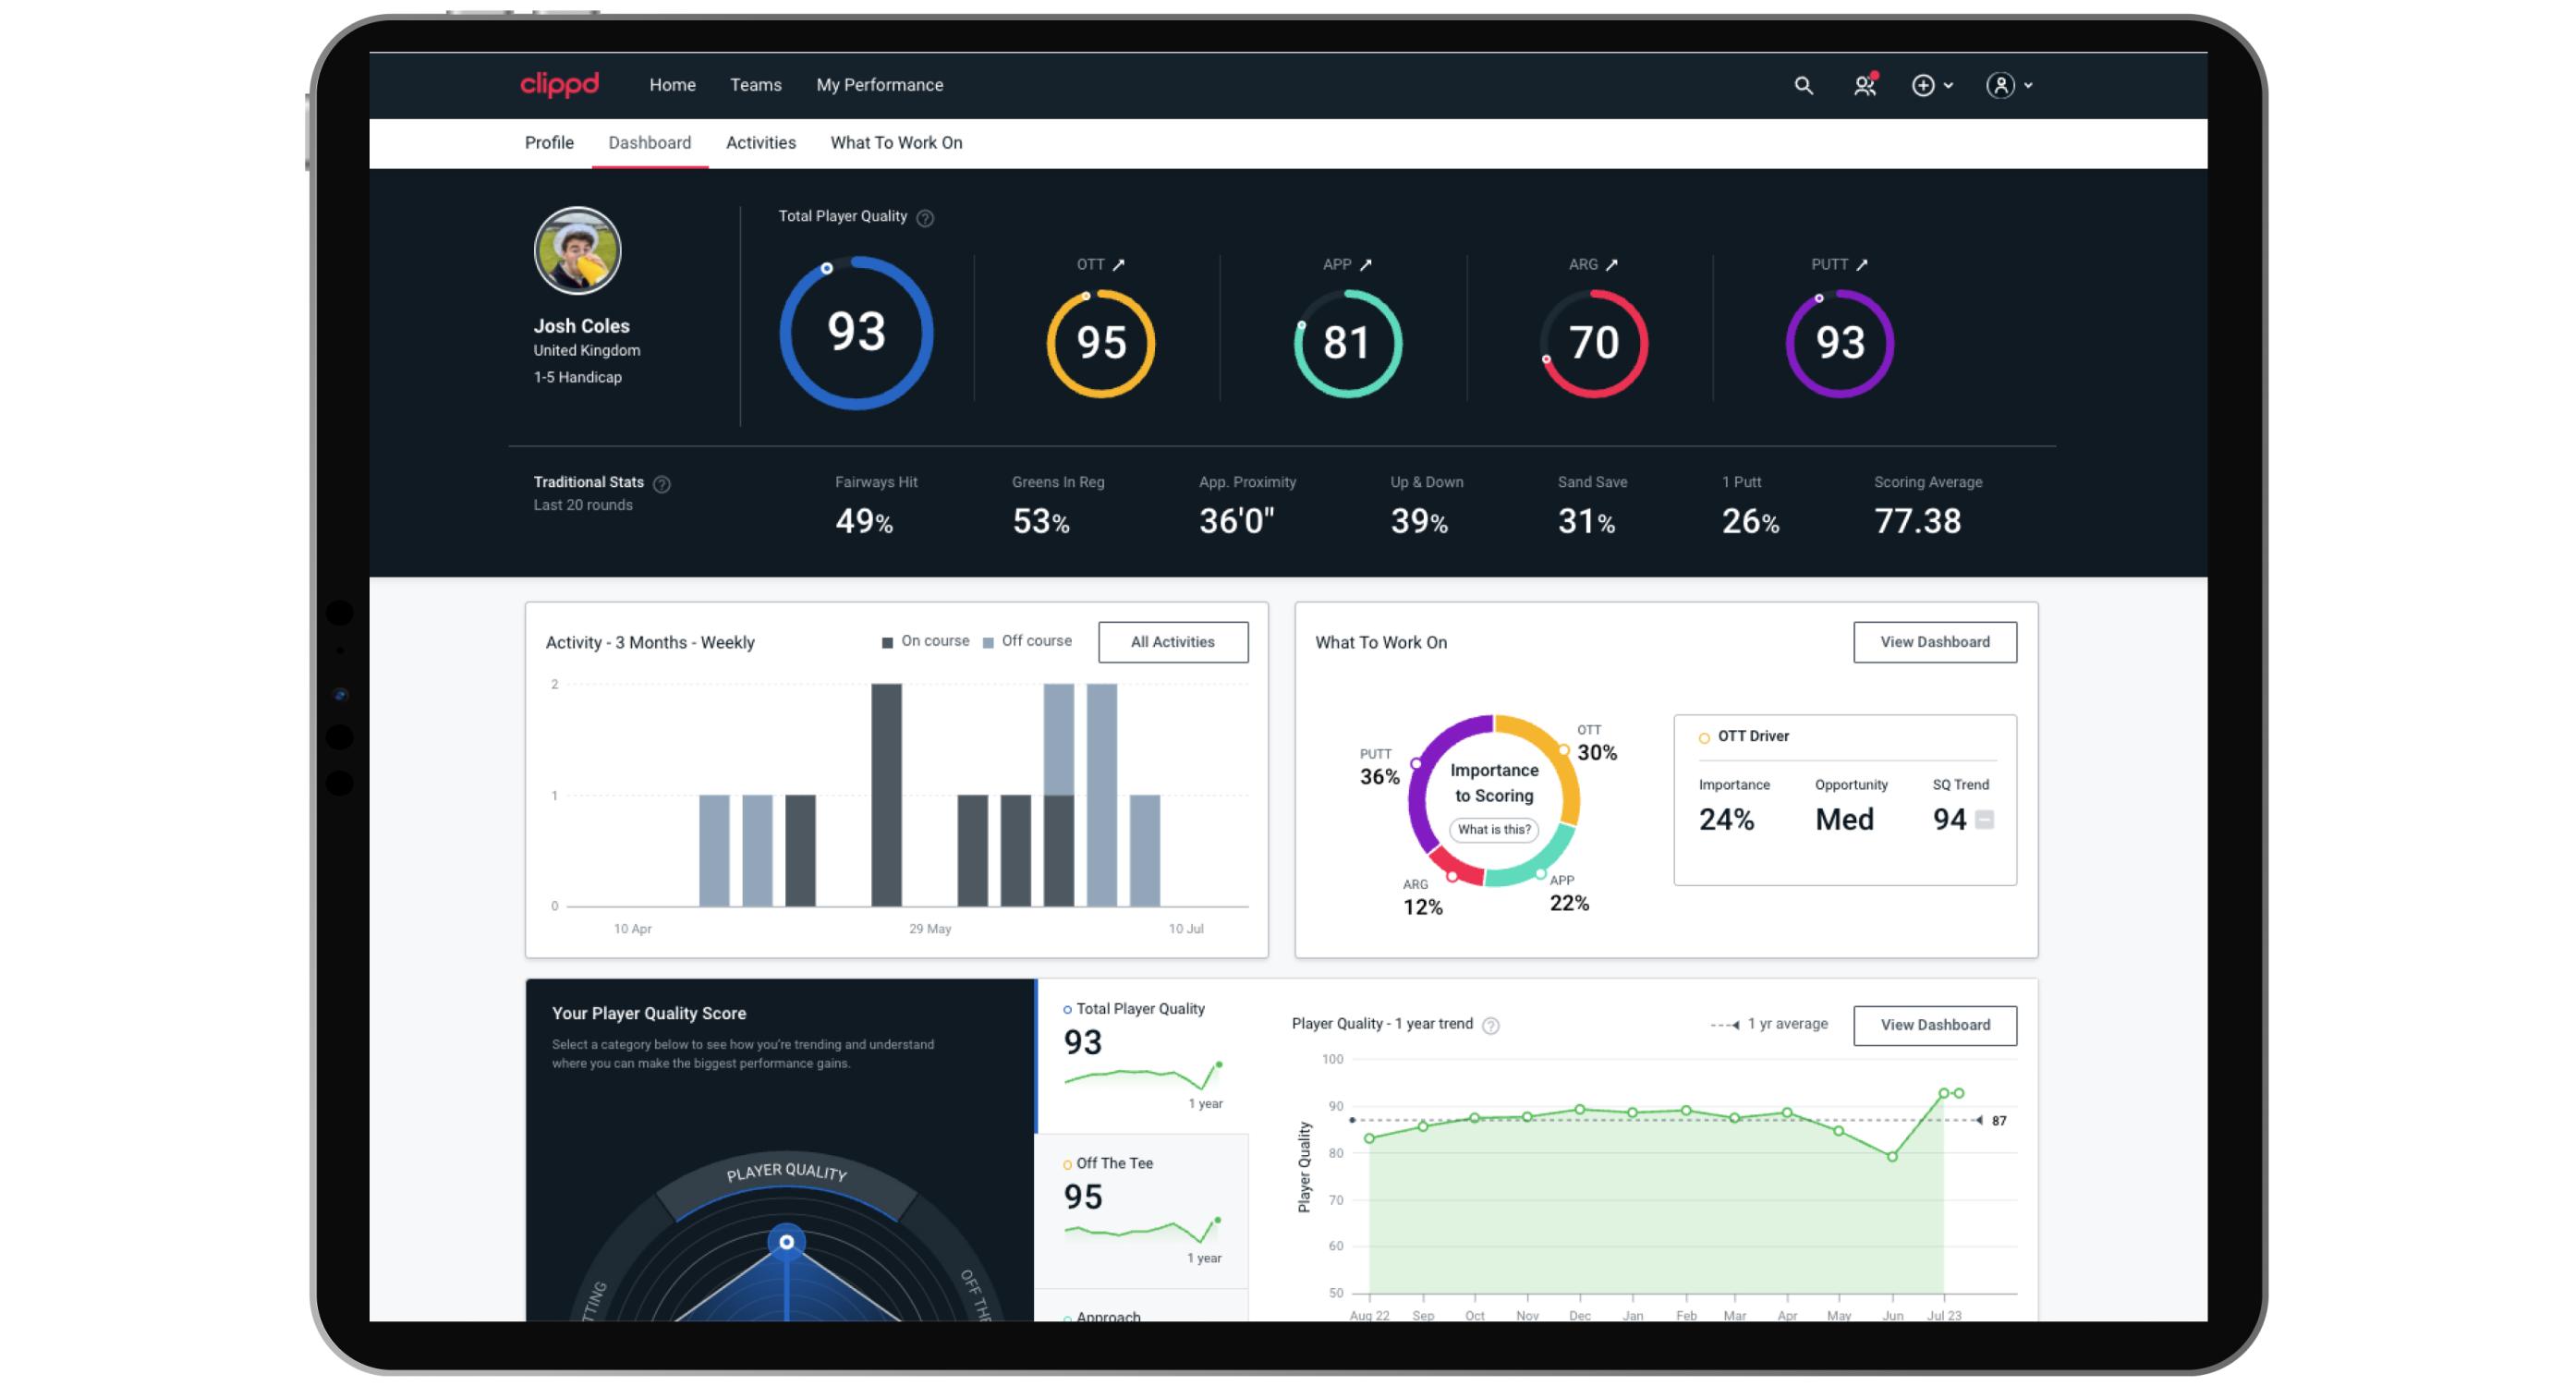
Firstly, to get to the Performance Dashboard's, click on one of your players Player Quality rings shown below.
What is What To Work On?
What is Shot Quality and Player Quality?
Here's a guide to a player's Performance Dashboards to help you understand what the data is telling you.
Firstly, to get to the Performance Dashboard's, click on one of your players Player Quality rings shown below.
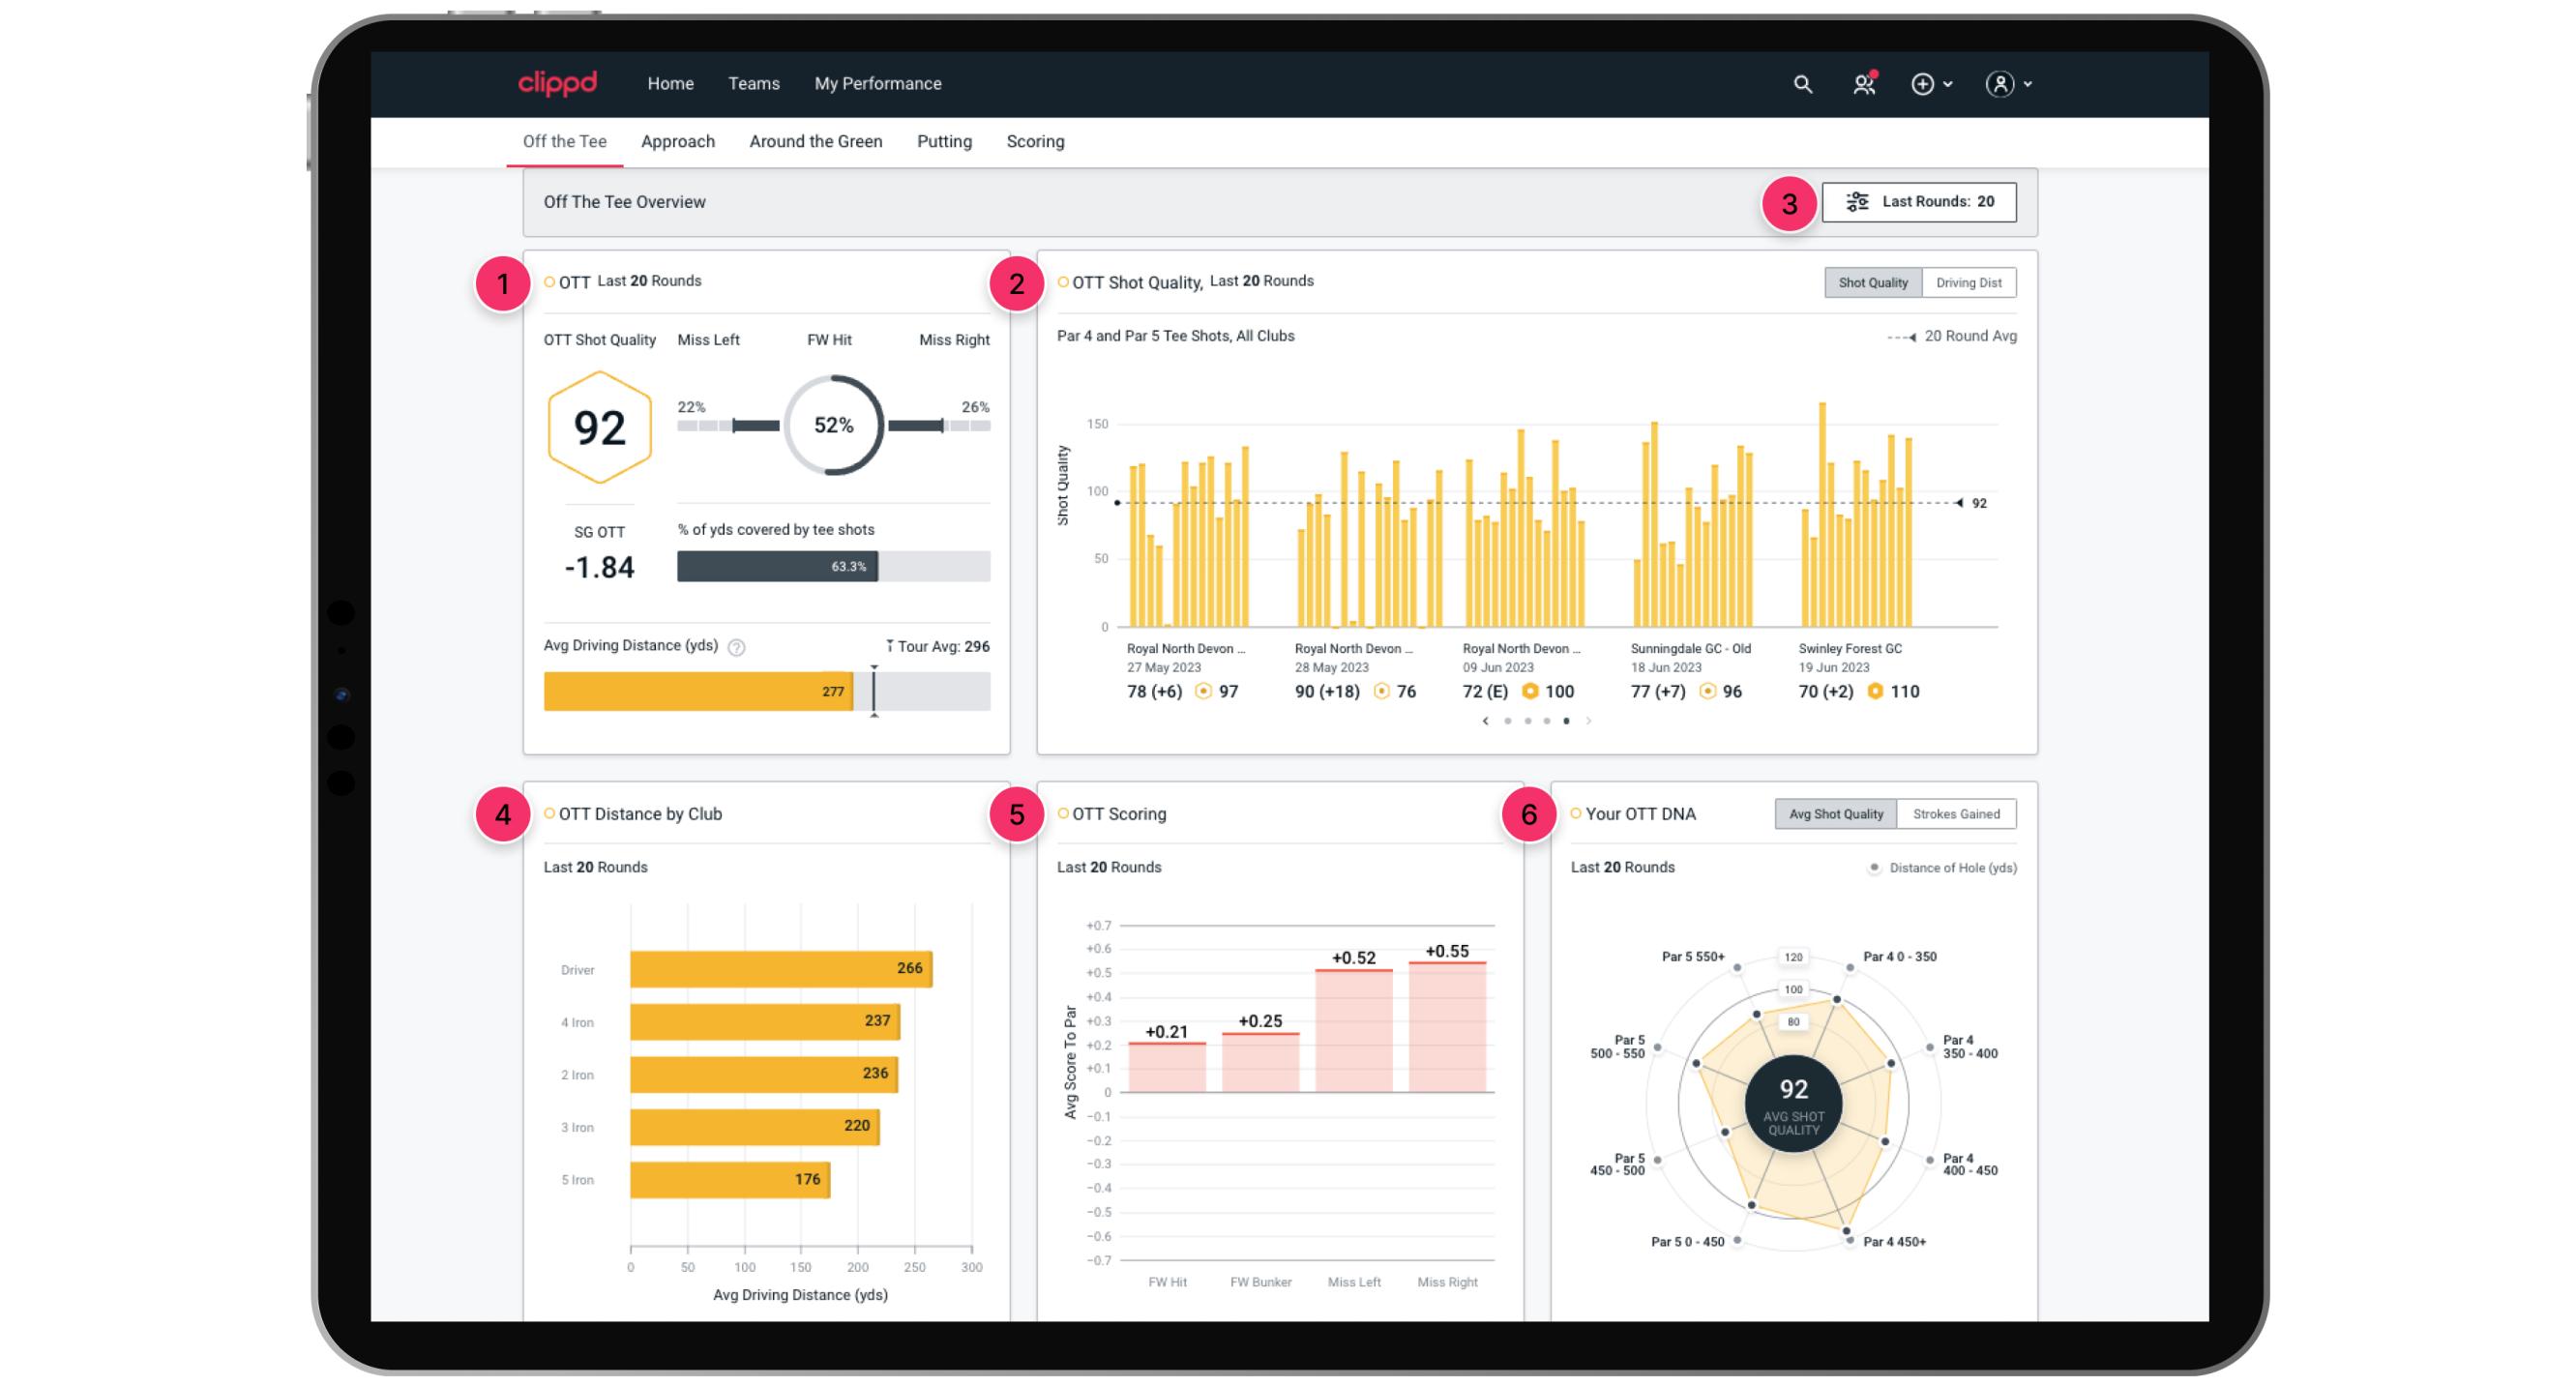
OTT Performance Dashboard
- This is an overview of their recent rounds for OTT.
- All their OTT shots for their recent rounds. You can change this to show driving distance.
- The Last Rounds filter allows you to select how many of their most recent rounds the data shown is based on. This will change every chart.
- Average shot distance for each club they have hit OTT in their recently rounds.
- Their scoring average based on each end lie they've hit an OTT shot.
- Their OTT Average Shot Quality for varying hole lengths and pars. You can change this to show Strokes Gained.
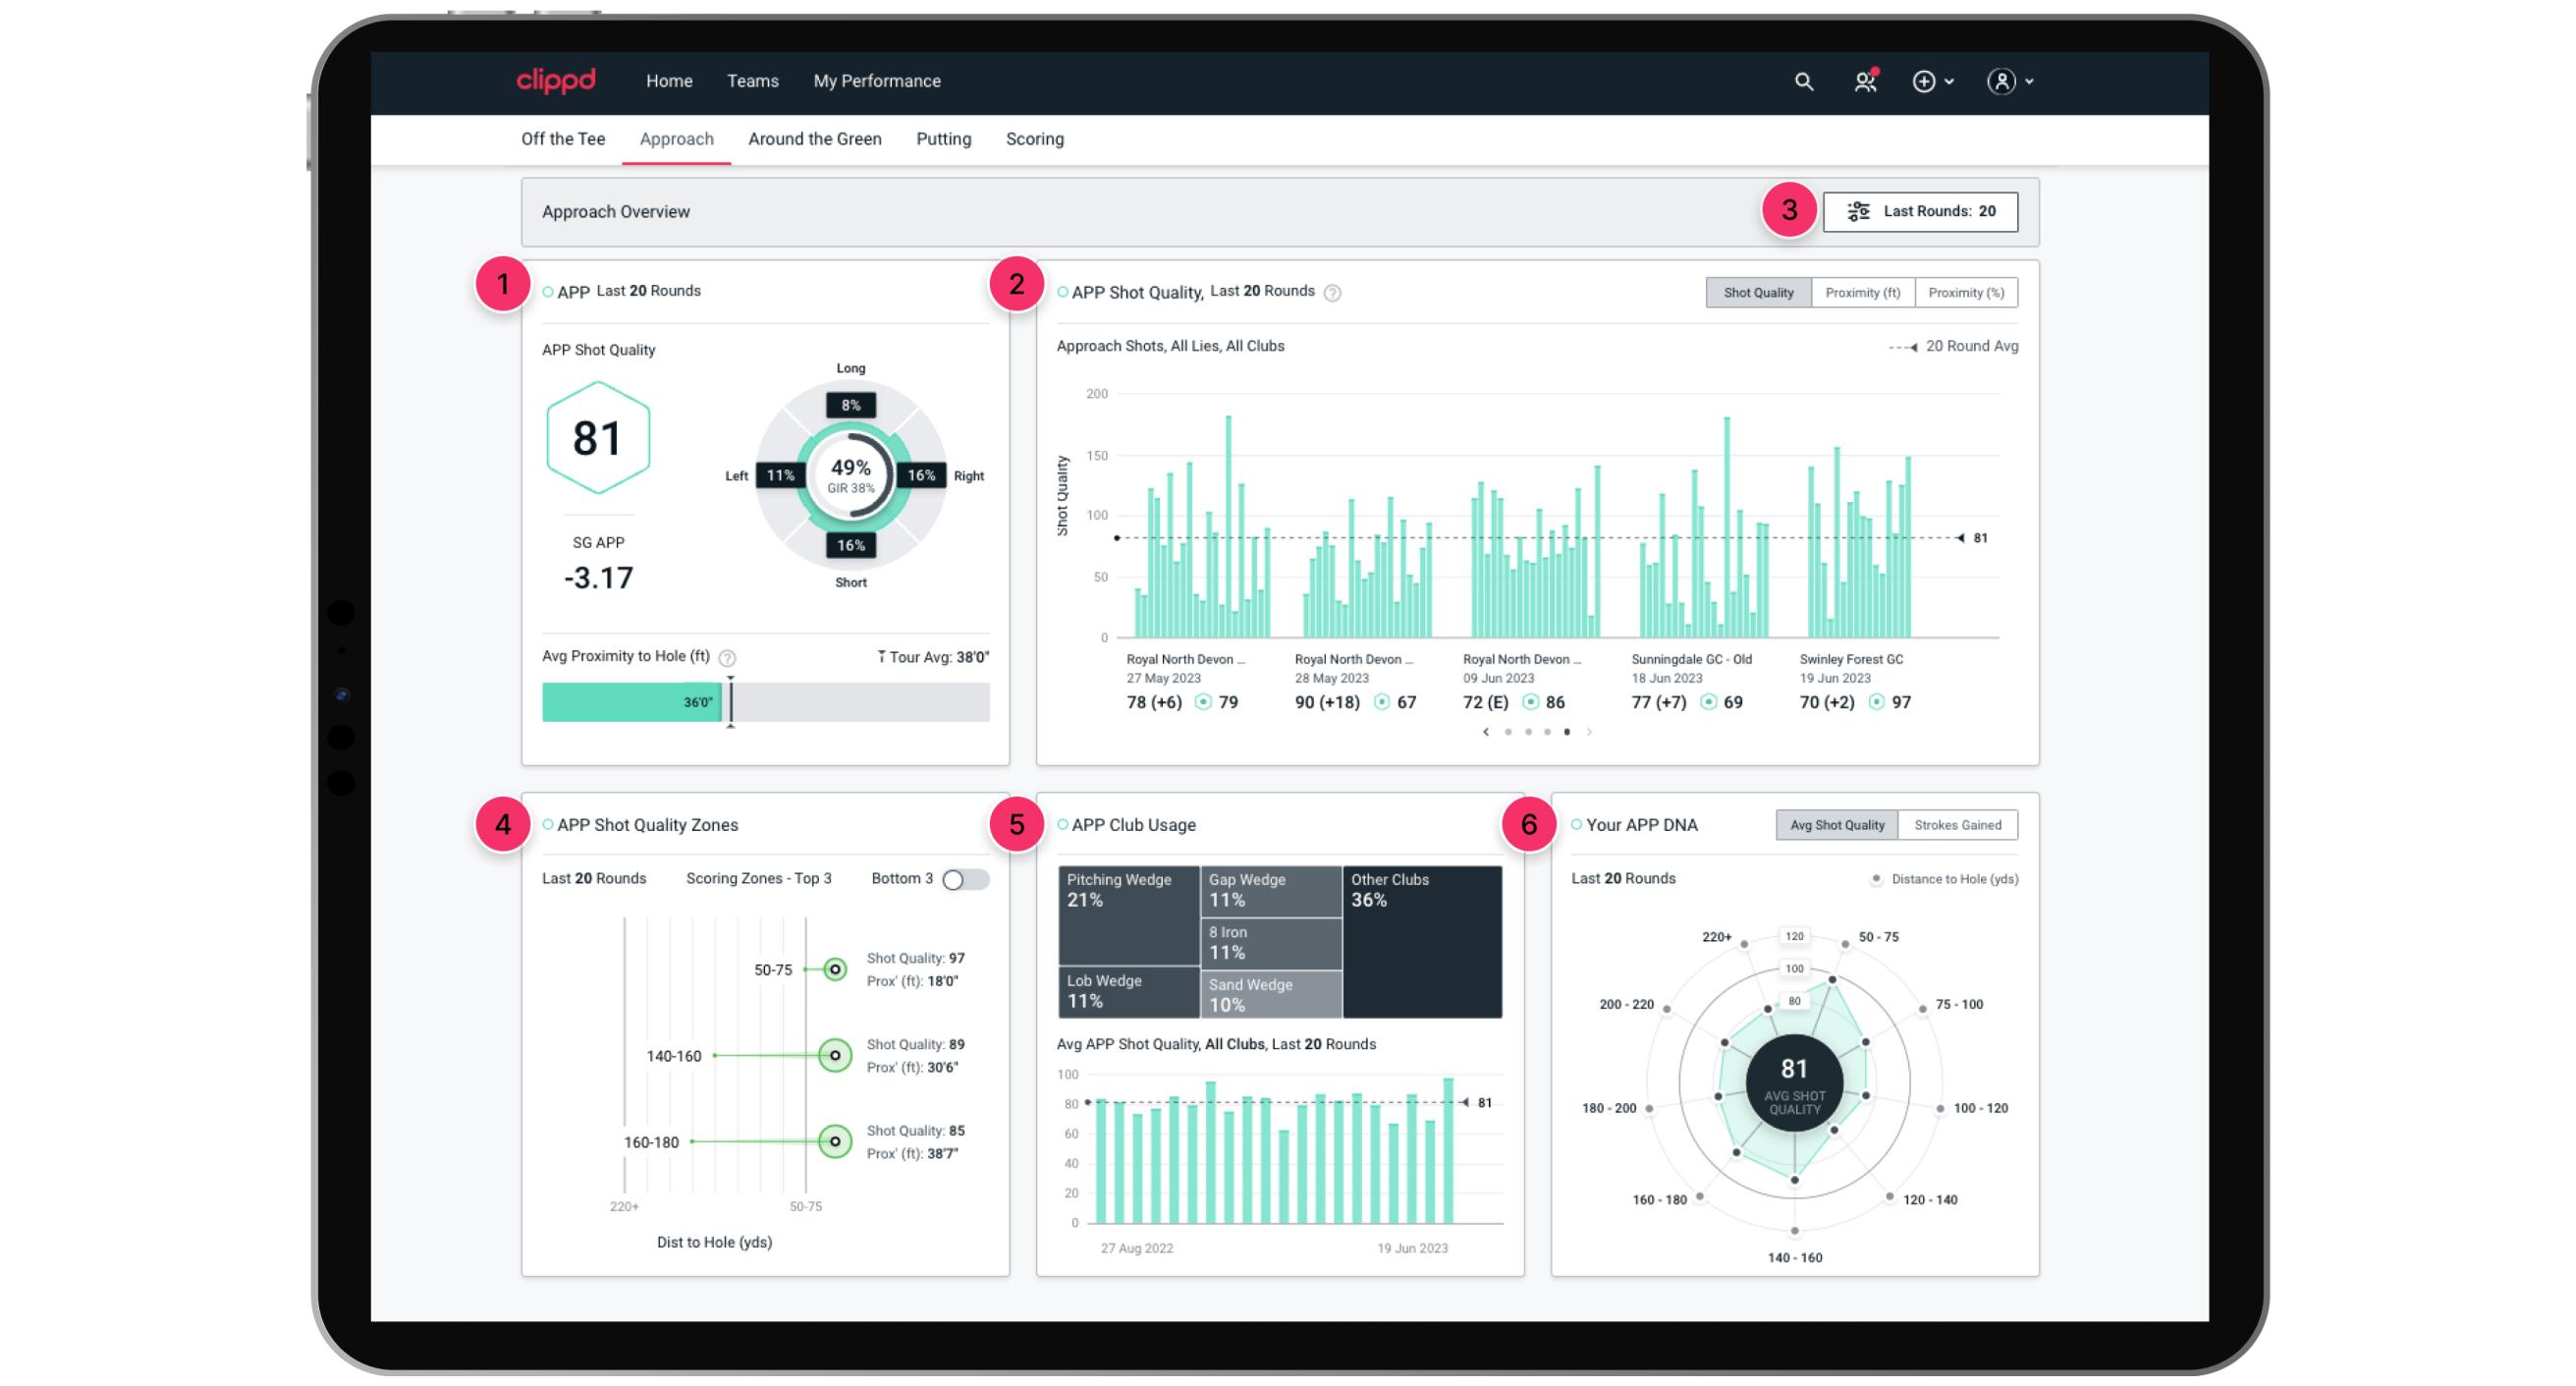
APP Performance Dashboard
- This is an overview of their recent rounds for APP.
- All of their APP shots for their recent rounds. You can change this to proximity in feet and as a percentage of the shots distance.
- Last Rounds filter allows you to select how many of their most recent rounds the data shown is based on. This will change every chart.
- Their top three and bottom three yardages for Shot Quality and the average proximity to the hole for that distance.
- How often they have hit specific clubs for APP and their average Shot Quality. You can select each of the clubs shown and see just the data for that club.
- Their APP Average Shot Quality for varying shot lengths. You can change this to show Strokes Gained.
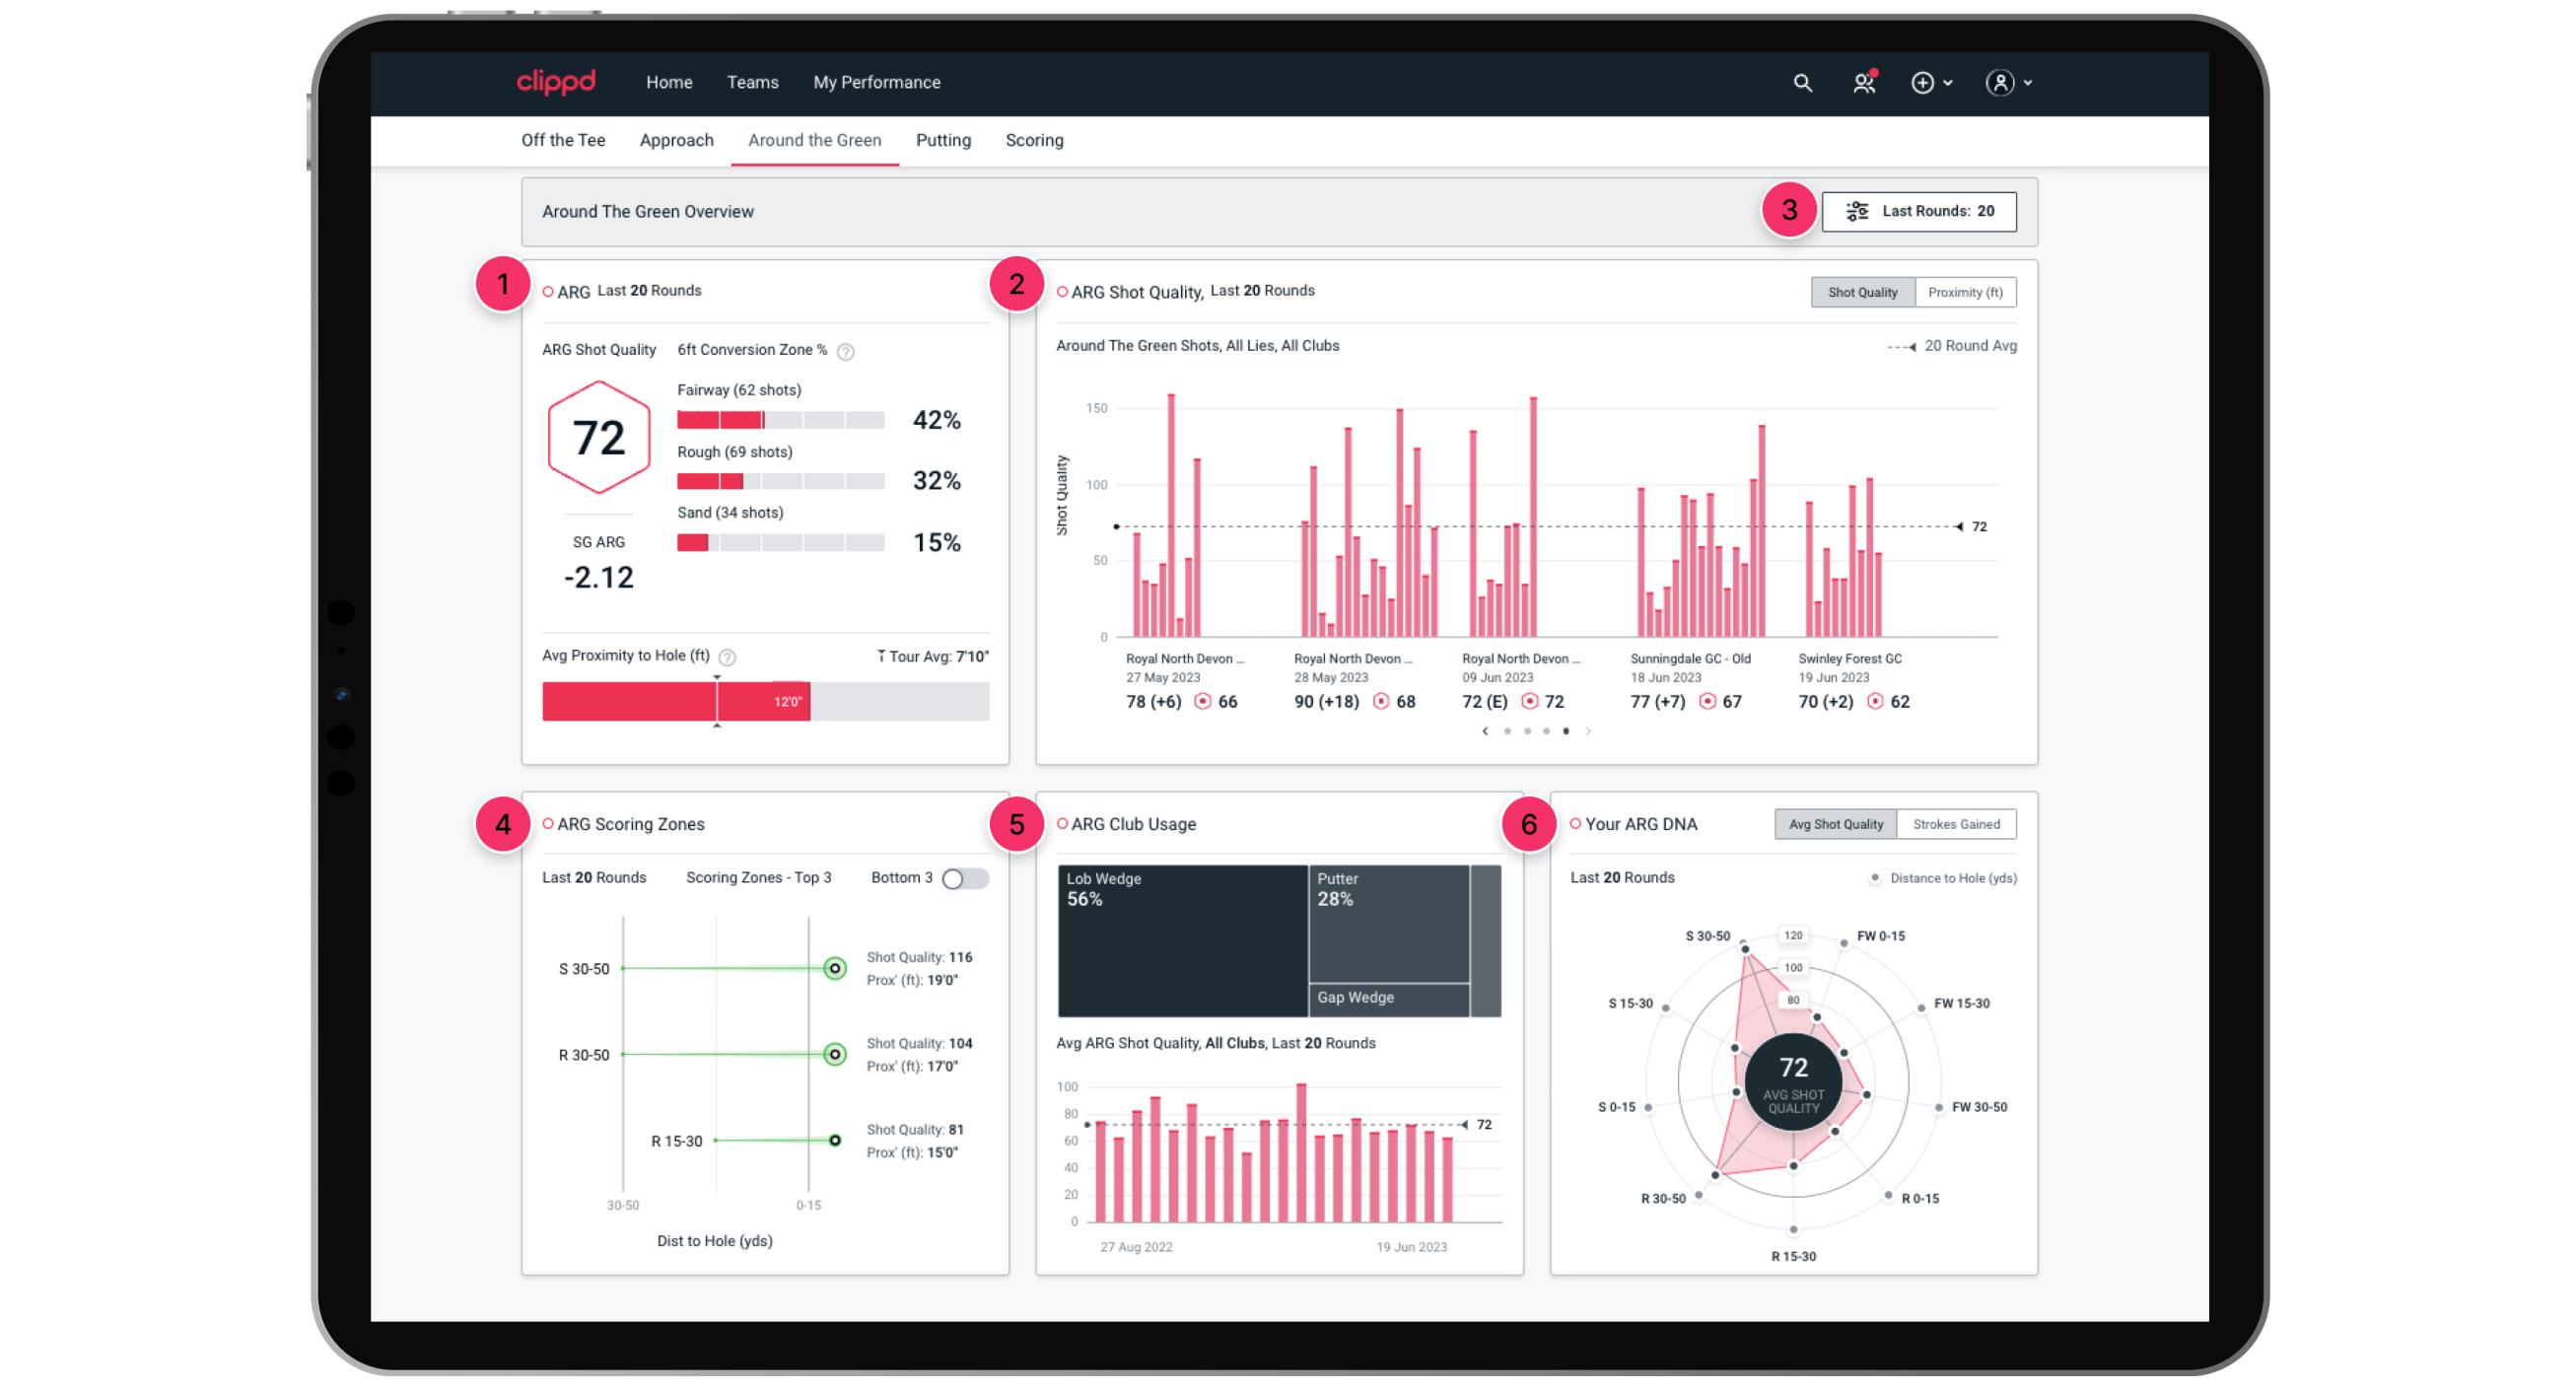
ARG Performance Dashboard
- This is an overview of their recent rounds for ARG.
- All of your ARG shots for their recent rounds. You can change this to show average proximity.
- Last Rounds filter allows you to select how many of their most recent rounds the data shown is based on. This will change every chart.
- Their top three and bottom three yardages and start lies for Shot Quality and the average proximity to the hole for that distance.
- How often they have hit specific clubs for ARG and their average Shot Quality. You can select each of the clubs shown and see just the data for that club.
- Their ARG Average Shot Quality for varying shot lengths and start lies. You can change this to show Strokes Gained.
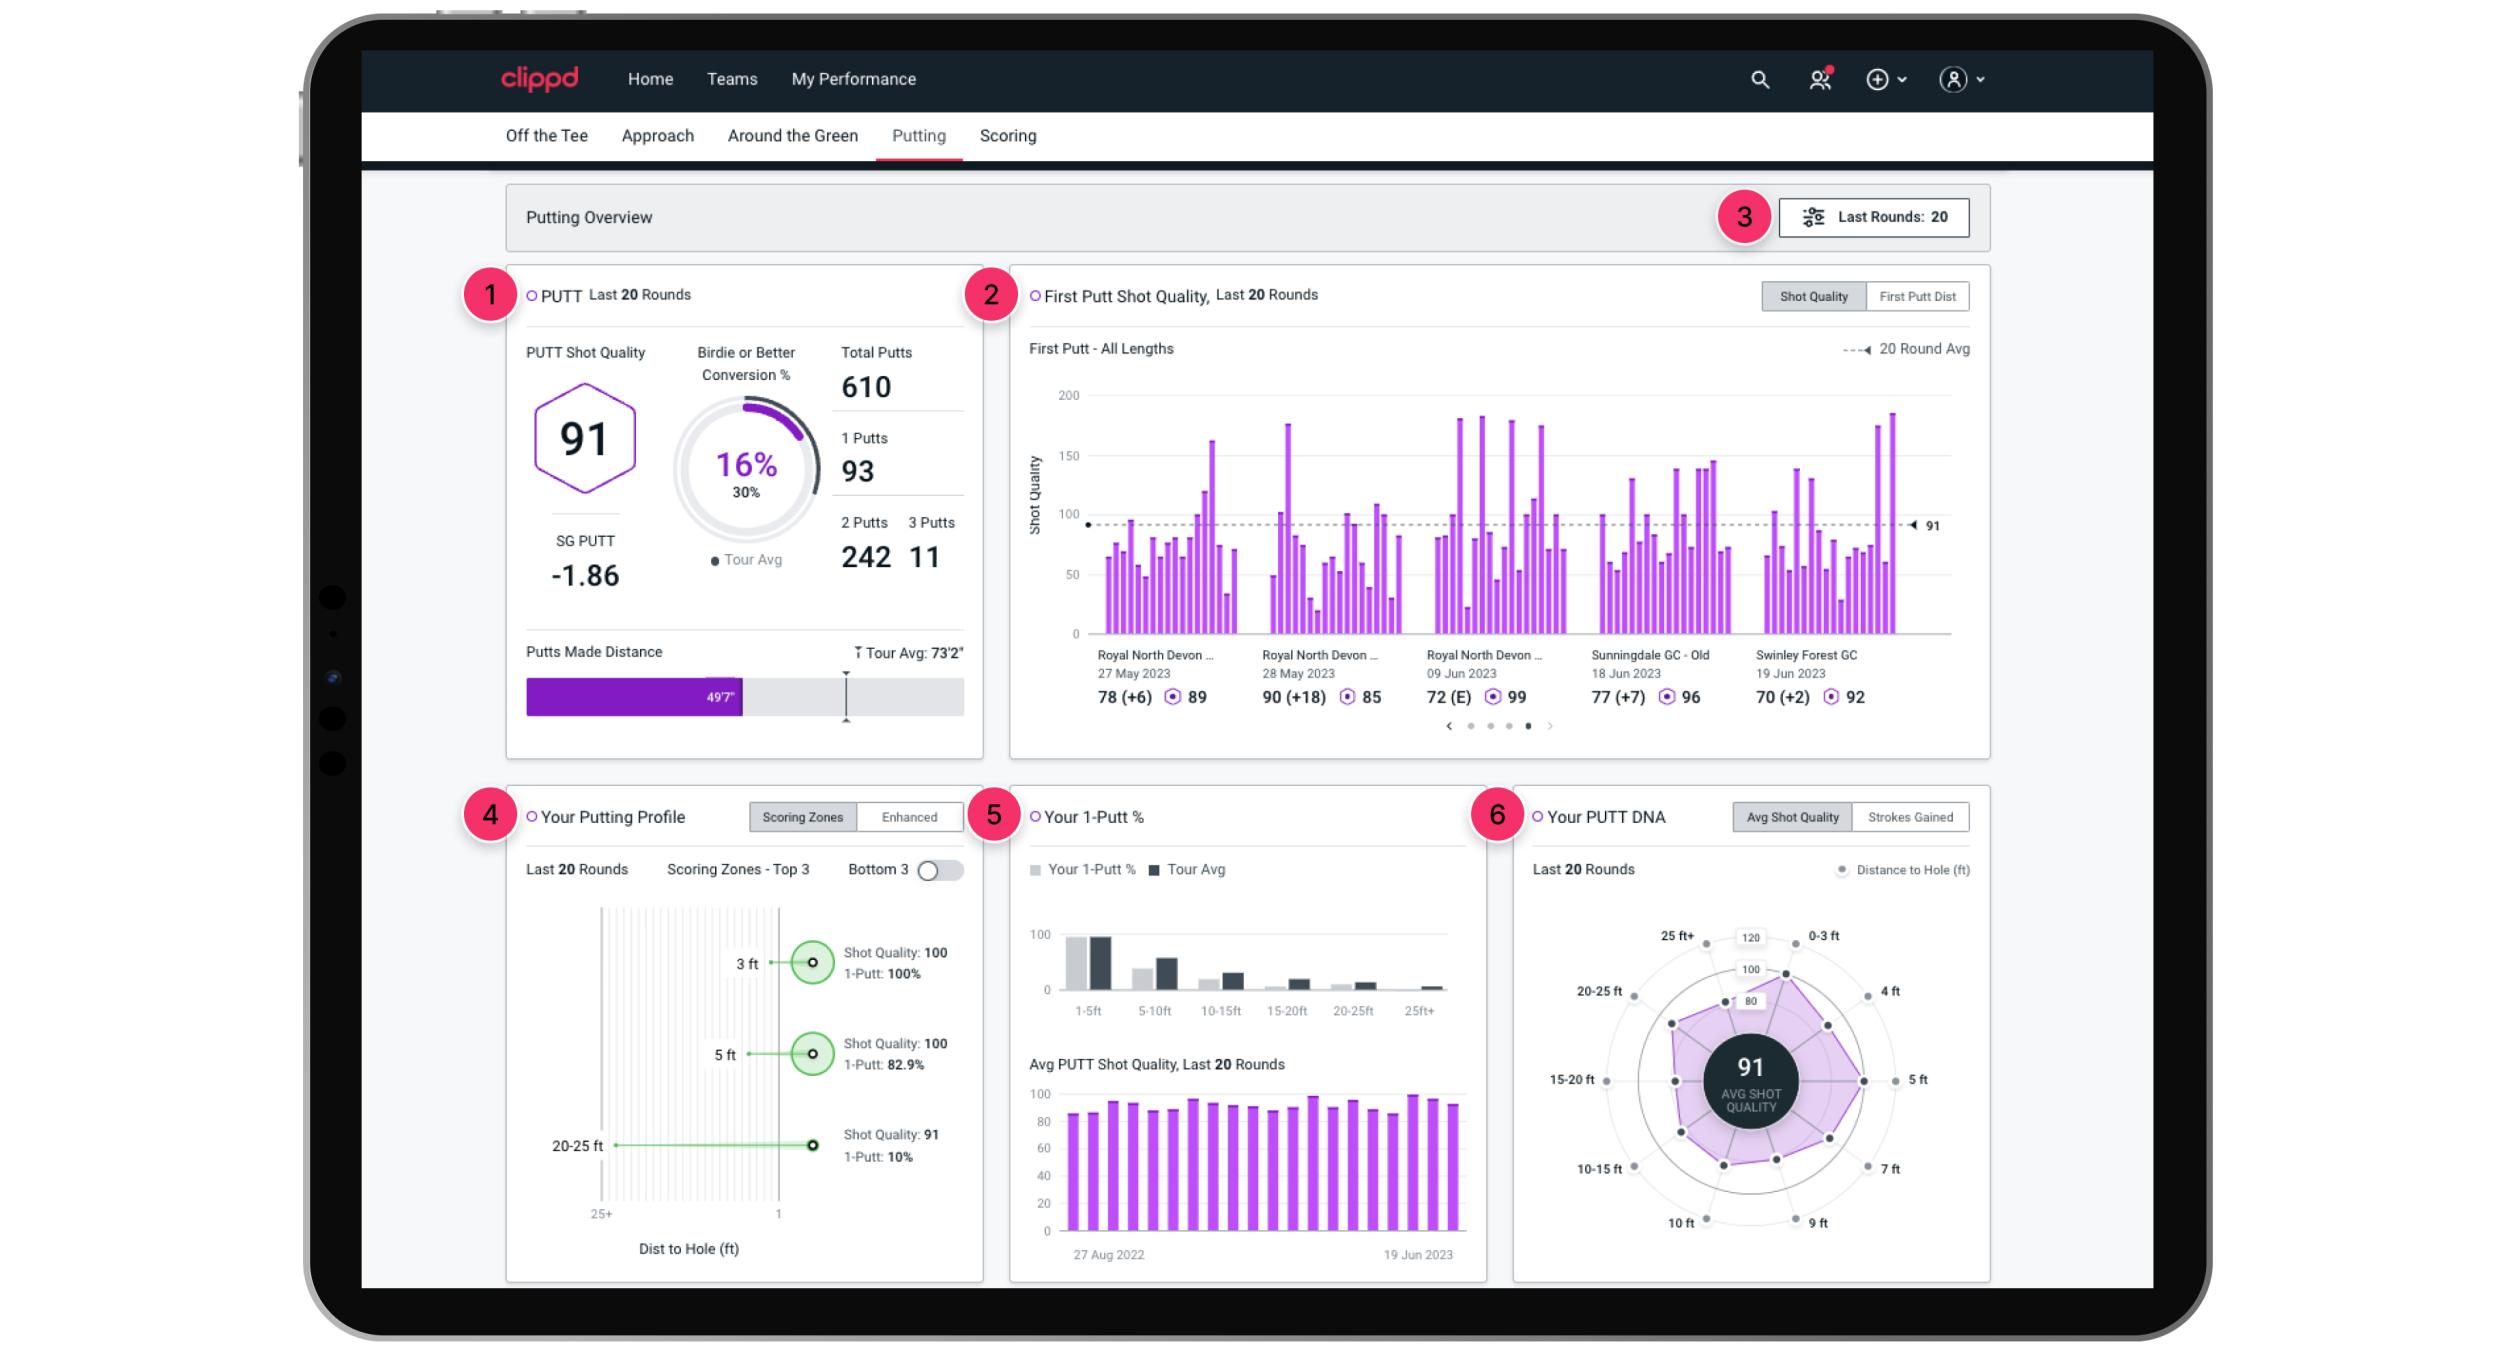
PUTT Performance Dashboard
- This is an overview of their recent rounds for PUTT
- All of your PUTT shots for their recent rounds. You can change this to show average distance for their first putt.
- Last Rounds filter allows you to select how many of their most recent rounds the data shown is based on. This will change every chart.
- Their top three and bottom three distances for Shot Quality and the average proximity to the hole for that distance.
- How often they have 1-putted from specific distances compared to tour average and their average Shot Quality for each round.
- Their PUTT Average Shot Quality for varying distances. You can change this to show Strokes Gained.
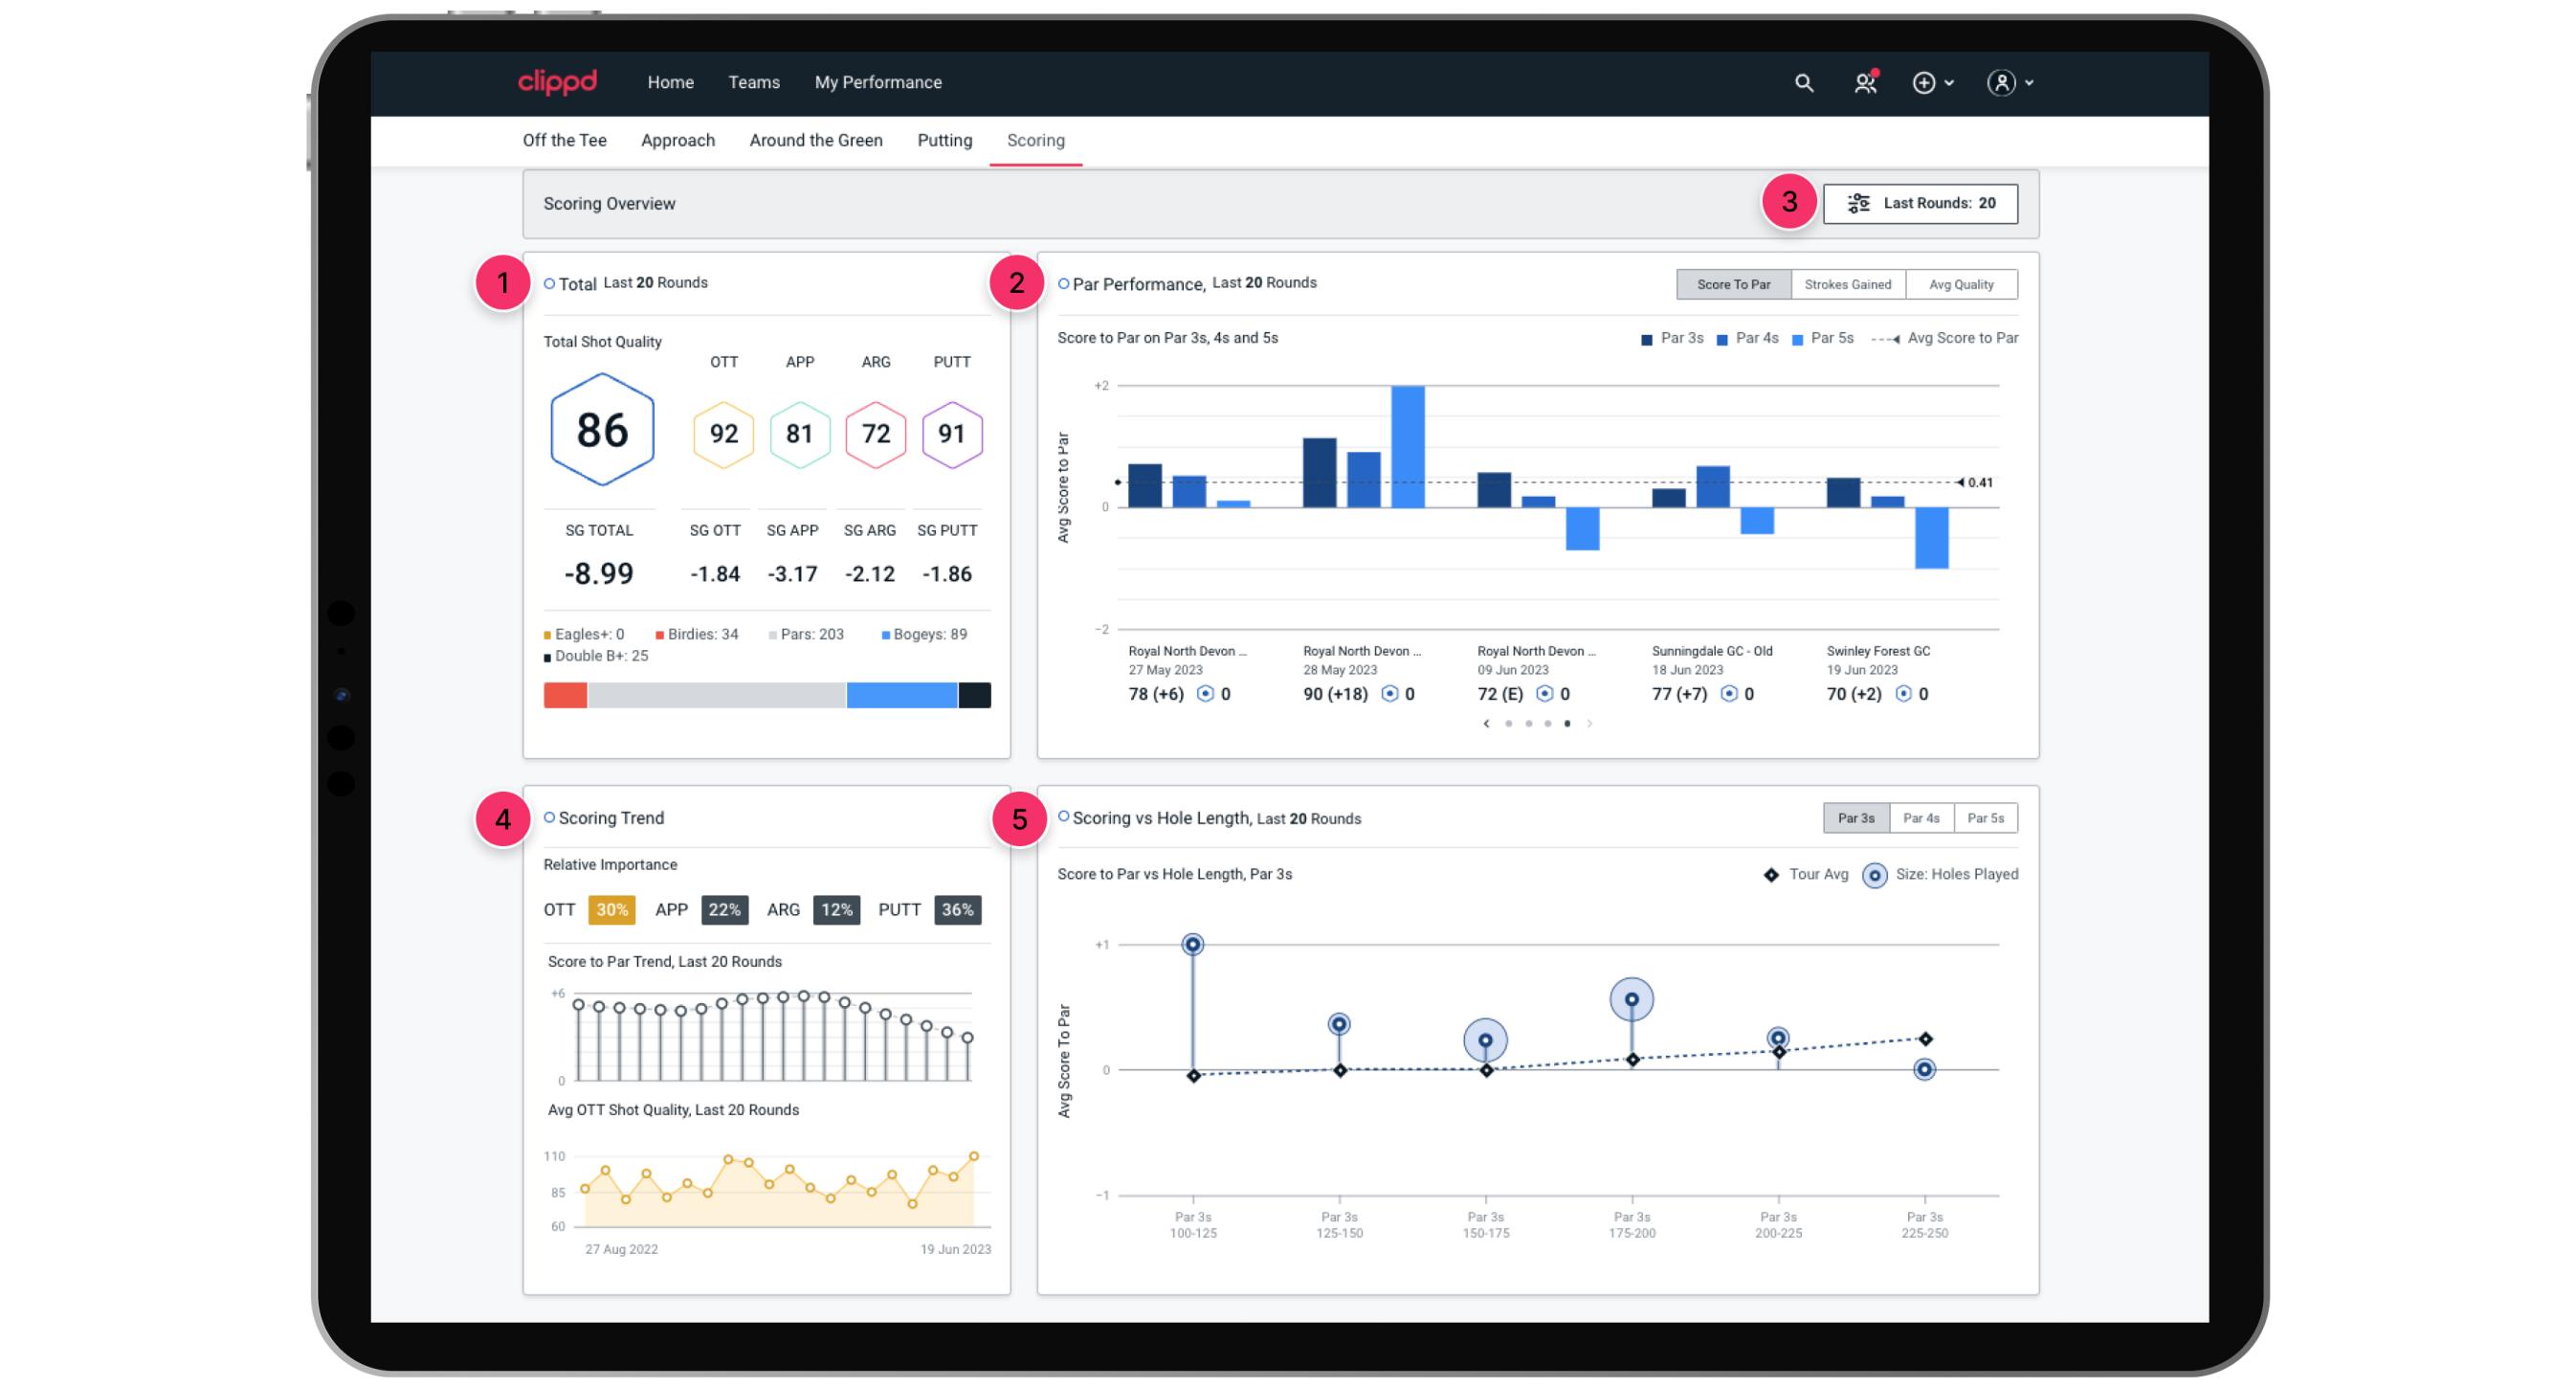
Scoring Performance Dashboard
- This is an overview of their recent rounds. It shows averages for both Shot Quality and Strokes Gained.
- Their scoring to par for Par 3s, 4s and 5s. You can change this to Strokes Gained and Average Shot Quality.
- Last Rounds filter allows you to select how many of their most recent rounds the data shown is based on. This will change every chart.
- Shows your importance to scoring for each area (exactly the same as What To Work On). Their Score to Par trend and Average Shot Quality for their recent rounds.
- Their scoring on specific hole lengths and pars compared to tour average.
What is What To Work On?
What is Shot Quality and Player Quality?
Last edited by Josh; 14-07-23 at 09:11.
Clippd's Community Manager