
What To Work On
Personalised, data-driven and actionable insights for every player and coach
What To Work On is a detailed, data-led view on your game at a point in time. Now you can see each part of your game broken down into sub-groups that link closely to a skill. For OTT, we look at your performance with a Driver, F/W wood and Other (irons or hybrids). For ARG, we look at the different lies you will play from, and so on.
We assess the impact all of these groups/skills have on your overall game through three dimensions – Importance to scoring, the Opportunity to improve and SQ Trend in terms of your Average Shot Quality.
A new Clippd Algorithm then produces a tailored, personalised and prioritised list of What To Work On suggestions, with supporting information on each to help you understand why and make more informed decisions on what to do next.
Your default What To Work On priority list is ranked by a combination of Importance, Opportunity and Shot Quality Trend. However, you can now select different ways to view your list. You can filter by:
Importance: The most important skills for your scoring.
Quick Wins: The skills where you can make the biggest gains in the shortest amount of time.
Shot Quality Trend: How you're trending in different skills.
Strengths: The best parts of your game in descending order.
Weaknesses: The weakest areas in descending order.
What To Work On: a user guide
How it works
Importance - Importance shows the current impact a part of your game has to your scoring. It’s shown as a percentage value, where a higher percentage means that specific area is more important to your scoring.
For example, if your ARG Fairway play tends to drive both good and bad scoring (you score well when it’s good, and poorly when it’s bad), Clippd recognises this resulting in a higher percentage for Importance. Equally, if your ARG Fairway has little impact on your scoring good or bad, Clippd would give this a lower percentage for Importance.
Opportunity - Opportunity is your potential to improve based on your previous ability in that area. A higher percentage means a greater opportunity to improve.
For example, if your OTT Driver is currently 82 for Shot Quality but has previously been 98, your Opportunity to improve would be high as you’ve been at a higher skill level previously.
Trend - Trend looks at whether your Shot Quality is improving or declining in a specific area. A green arrow indicates you are improving, a red arrow shows a decline.
For example, if your PUTT 8-15 ft went from 86 Shot Quality to 90 Shot Quality, you would see a green arrow. Clippd also factors in how much or quickly you are improving or declining in that specific area.
Opening up What To Work On (desktop)
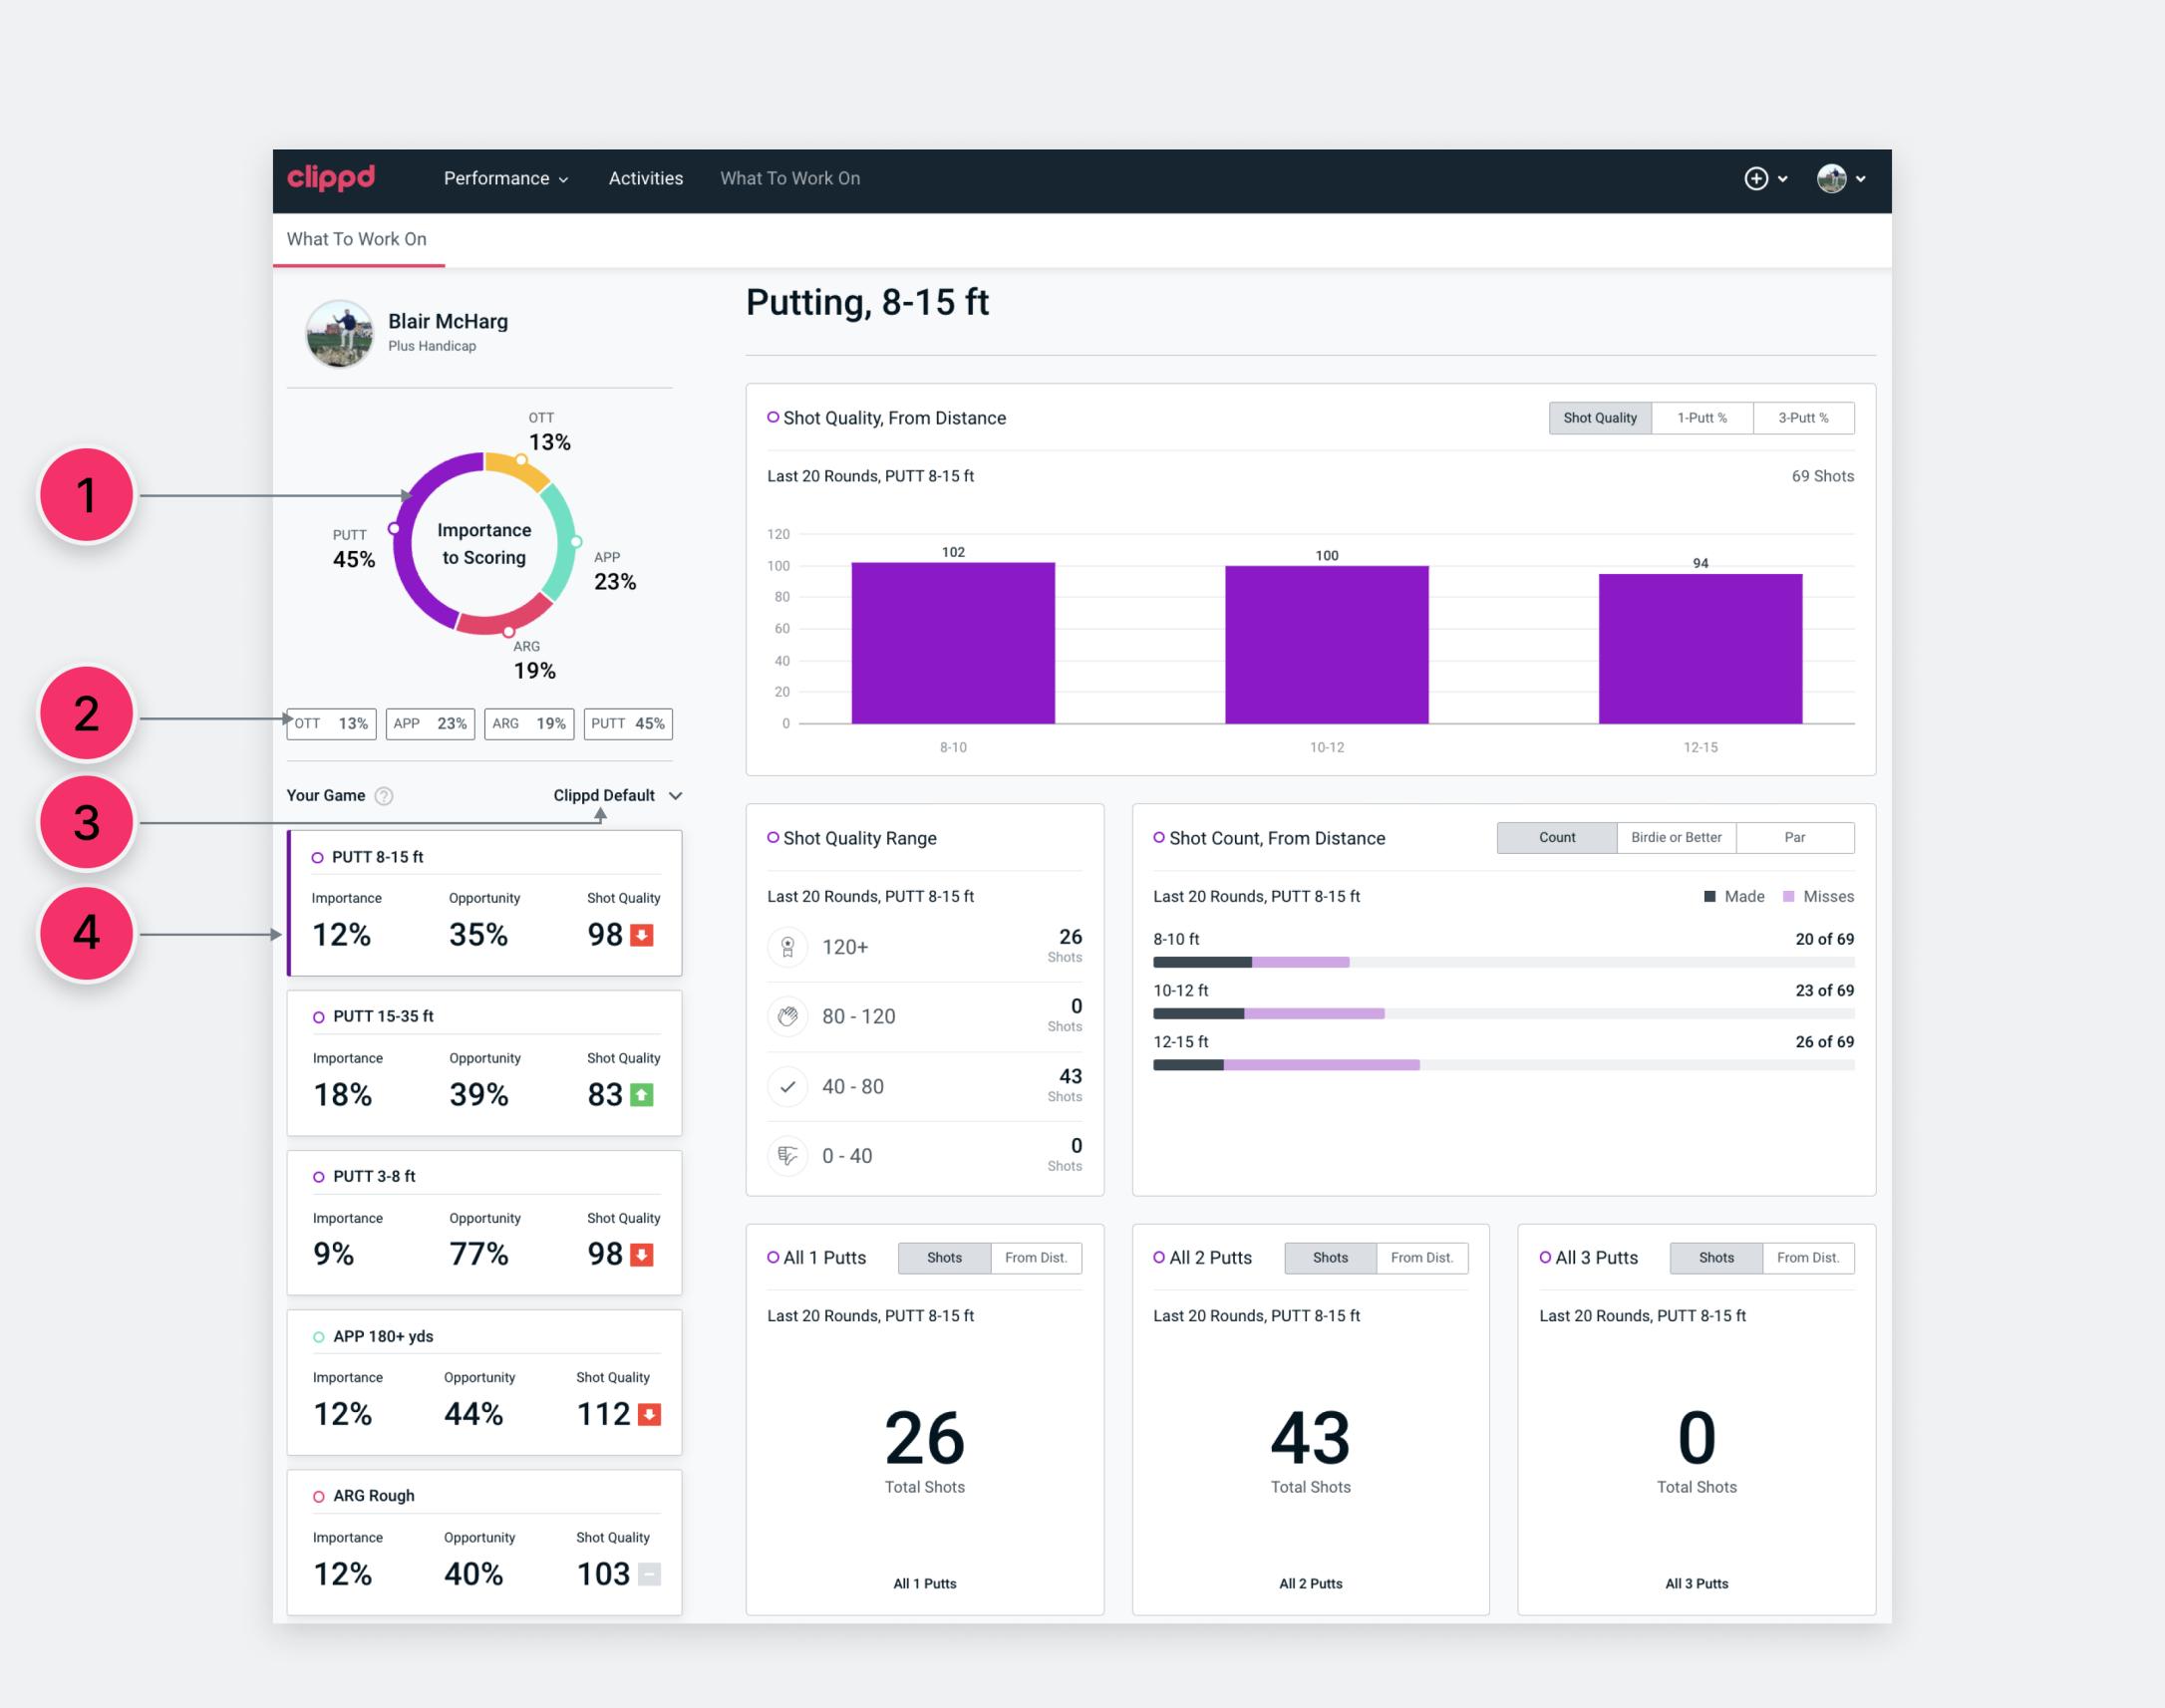
1. The Importance to Scoring chart matches what is shown in Relative importance on your Scoring dashboard.
2. You can choose to view your overall game in one priority list or filter by OTT, APP, ARG and PUTT, or a selection of any two or three. This means the next time you head to the range, the chipping green or the putting green, you can see how to make the best use of your time.
3. You can choose how to view the priority list, with the option to toggle between Clippd Default, Importance, Opportunity and Shot Quality via the dropdown menu. Clippd Default is the output from our new algorithm that prioritises the parts of the game you should be working on. It ranks the group/skill by a combination of Importance, Trend and Opportunity, with more weight placed on Importance.
4. The left side of the dashboard drives the right part of the screen. When you open What To Work On it will display the Clippd Default list of priorities for your overall game, with your highest priority at the top of the list. In this case, Blair’s number one What To Work On priority is his putting from 8-15ft. Each group/skill is clickable, revealing the supporting information to the right.
Opening up What To Work On (mobile)
1. The Importance to Scoring chart matches what is shown in Relative importance on your Scoring dashboard.
2. You can choose to view your overall game in one priority list or filter by OTT, APP, ARG and PUTT, or a selection of any two or three.
3. You can choose how to view the priority list, with the option to toggle between Clippd Default, Importance, Opportunity and Shot Quality via the dropdown menu.
4. When you open What To Work On it will display your highest priority at the top of the list. Here, we have scrolled down Blair’s What To Work On list of priorities and selected APP 140-180 yds.
5. You can scroll through the different data visualisations for APP 140-180 yds, choosing how you want to view or filter the information in many cases.
What To Work On – OTT
Groups/skills: The scrolling list is split into OTT Driver, OTT F/W (fairway woods) and OTT Other (irons). We include hybrids as Other.
1. Select Pars 4s or Par 5s to see the trend line for your last 20 rounds. Hover on points on the trend line to see the round details or click to access Scorecard, Round Insights and Shot by Shot for individual rounds. The trend line takes into account penalty shots.
2. See how many OTT shots found the fairway, rough, sand or caused you to play a recovery shot. Average distances are shown for each. Shots that led to a Recovery include penalties, so the average distance here might seem low.
3. See your percentage of fairways hit and missed overall. Select Rounds option to view a breakdown of your last 20 rounds. Hover on each bar in the chart to see fairways hit, missed and total number of shots.
4. View the trend line for your Average Distance in yards for the last 20 rounds. Click on each point on the graph to show Average Shot Quality, Average Distance and total number of shots.
What To Work On – APP
Groups/skills: The scrolling list is split into the APP distances – 50-100 yards, 100-140 yards, 140-180 yards, 180+ yards.
1. Each distance bin is broken down into the same App distance categories shown in your APP DNA. Hover on each bar in the chart to see your Average Shot Quality, Green Hit % and total number of shots at each distance.
2. Select a distance to see your Average Shot Quality trend line and number of shots played over your last 20 rounds. Hover on points on the graph to see more.
3. From different distances and different starting lies, discover how often — in number of shots or as a percentage of shots — you find the green, fairway, rough, sand or a lie that requires a recovery shot.
4. See your Average Shot Quality from different positions on the course at different distances, with the option to break down these yardages still further. Hover over the bars to see how many shots you have played from each start lie.
5. How often do you hit the green when you are deemed to be going for the green? This can be broken down into the different start lies with the green circle denoting percentage.
6. On shots where you are going for the green, how close do you get to the hole? This can be broken down into different start lies. Toggle to see only shots that found the green and only those that missed the green, as well as comparing yourself to the PGA tour average.
What To Work On – ARG
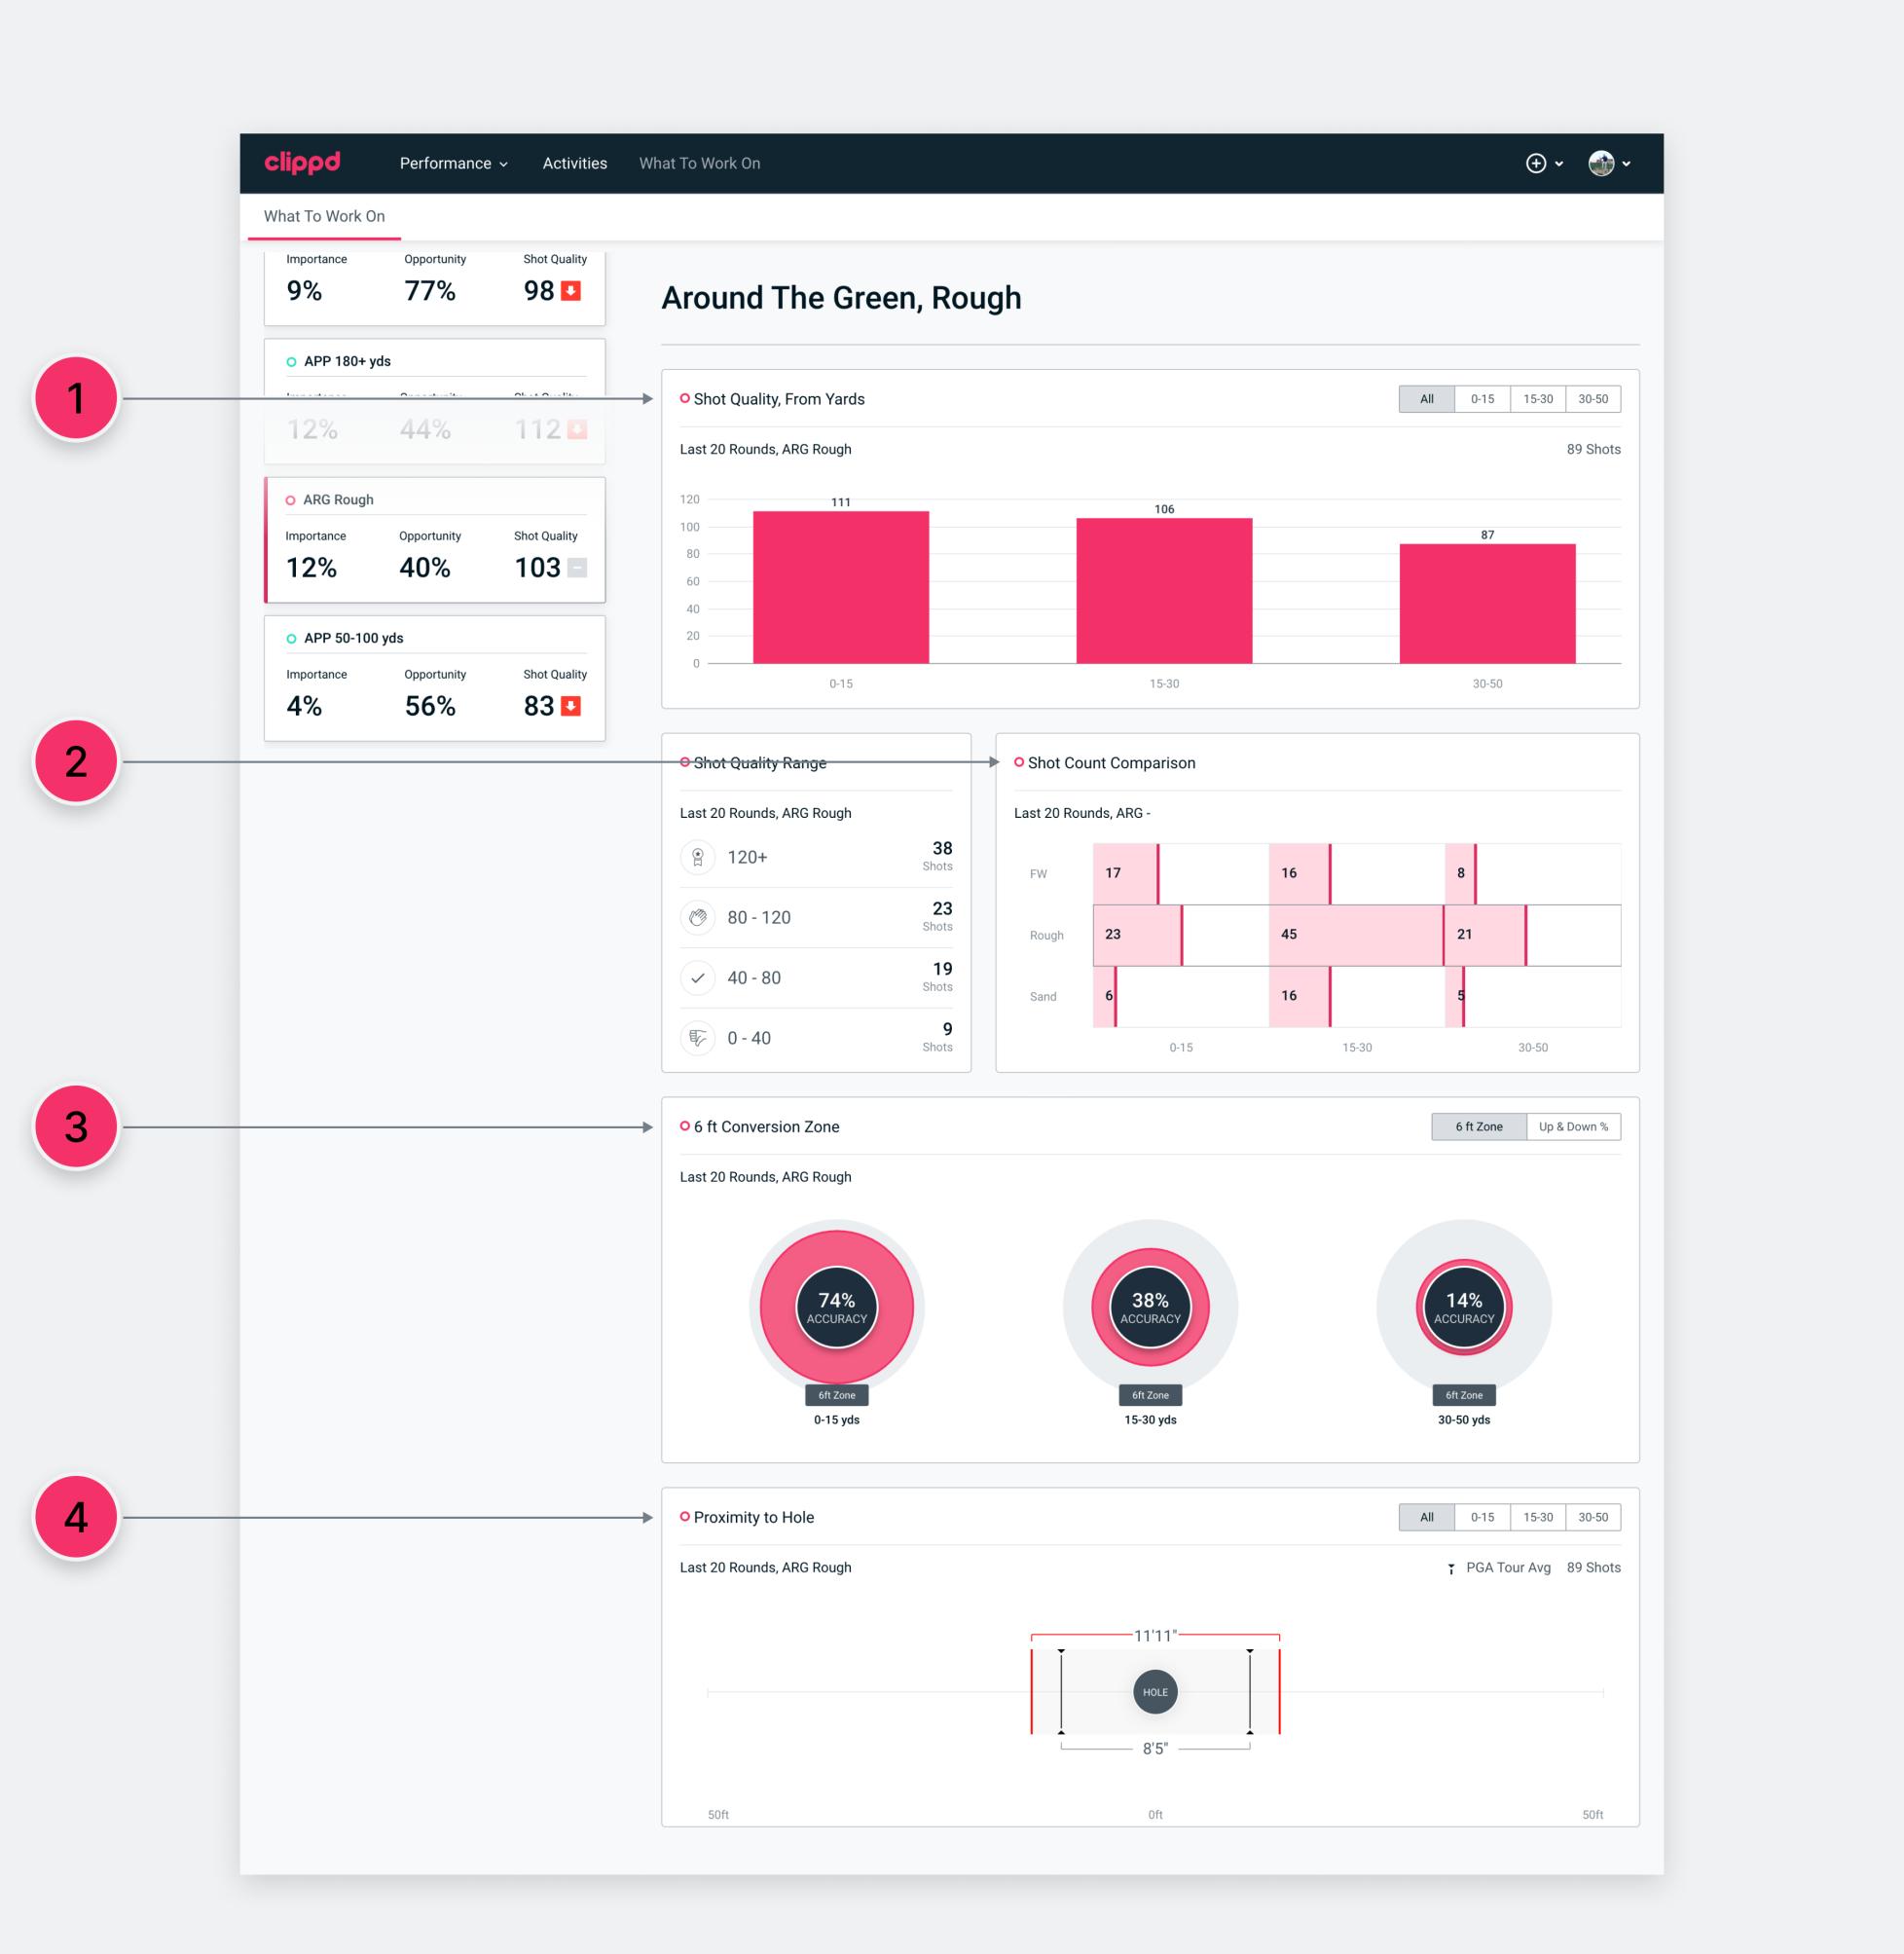
Groups/skills: The scroll bar is split into the three start lies – FW, rough and sand.
1. Average Shot Quality from the three different lies are broken down at different distances. Select a distance bin to see the trend line for Average Shot Quality over the last 20 rounds and number of shots played at each distance. Hover over points on the trend graphs to see more.
2. Shot Count Comparison breaks your ARG shots down into start lies and distances.
3. See how often you finished inside the 6ft conversion zone from different lies and different distances in your last 20 rounds. You can also view your Up & Down % at each distance.
4. Your average proximity to the hole from different distances across the last 20 rounds compared with the PGA tour average.
What To Work On – PUTT
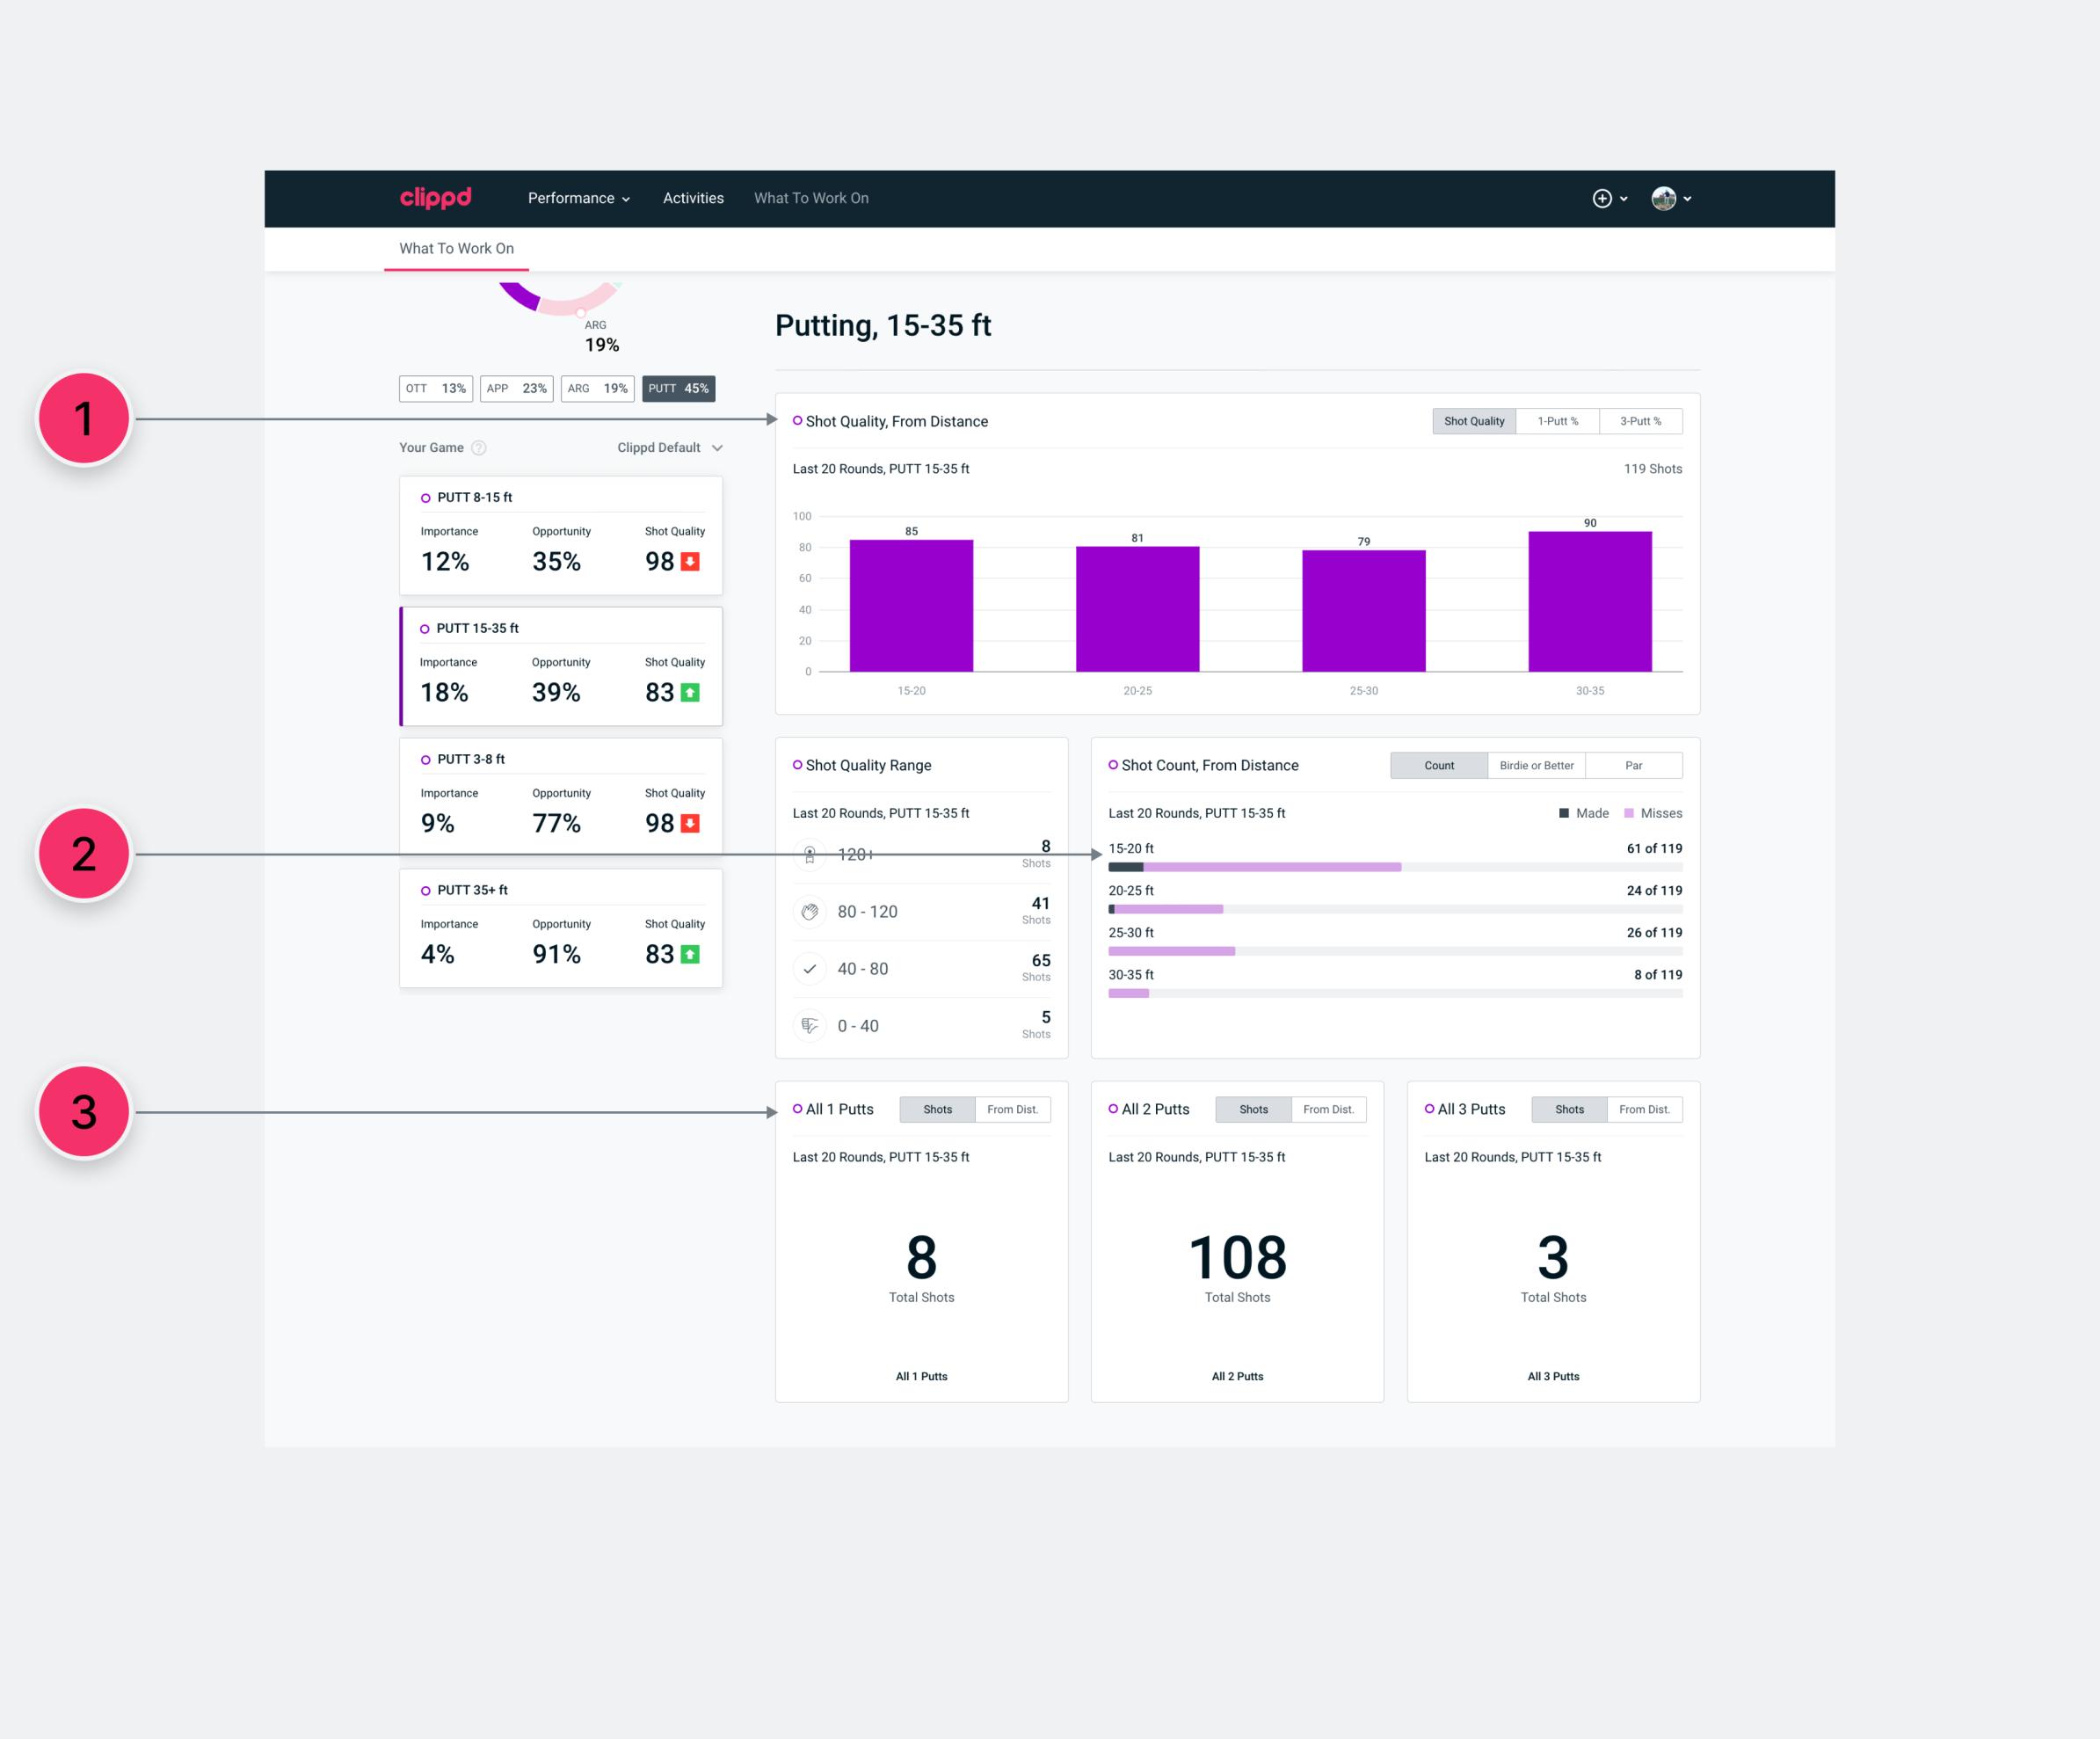
Groups/skills: The scrolling list is split into five distances: 0-3ft, 3-8ft, 8-15ft, 15-35ft, 35ft+.
1. Each sub-group is broken down into smaller distance bins showing Average Shot Quality. Hover over each bar to see the number of putts at each distance and number of putts made. You also have the option to view your 1-Putt% and 3-Putt%.
2. See how many putts you hit at each distance and how many you hole and miss. View the same make and miss rates on putts for birdie or better and on par putts.
3. See your total number of 1, 2 and 3-putts as total number of shots and broken down into smaller distances bins within the sub-group.
We hope you find your What To Work On interesting and useful. If you have a question about any aspect of the feature, simply click 'Reply to Thread' below and we'll respond.
Personalised, data-driven and actionable insights for every player and coach
What To Work On is a detailed, data-led view on your game at a point in time. Now you can see each part of your game broken down into sub-groups that link closely to a skill. For OTT, we look at your performance with a Driver, F/W wood and Other (irons or hybrids). For ARG, we look at the different lies you will play from, and so on.
We assess the impact all of these groups/skills have on your overall game through three dimensions – Importance to scoring, the Opportunity to improve and SQ Trend in terms of your Average Shot Quality.
A new Clippd Algorithm then produces a tailored, personalised and prioritised list of What To Work On suggestions, with supporting information on each to help you understand why and make more informed decisions on what to do next.
Your default What To Work On priority list is ranked by a combination of Importance, Opportunity and Shot Quality Trend. However, you can now select different ways to view your list. You can filter by:
Importance: The most important skills for your scoring.
Quick Wins: The skills where you can make the biggest gains in the shortest amount of time.
Shot Quality Trend: How you're trending in different skills.
Strengths: The best parts of your game in descending order.
Weaknesses: The weakest areas in descending order.
What To Work On: a user guide
- How it works
- Opening up What To Work On (desktop)
- Opening up What To Work On (mobile)
- What To Work On - OTT
- What To Work On - APP
- What To Work On - ARG
- What To Work On - PUTT
How it works
Importance - Importance shows the current impact a part of your game has to your scoring. It’s shown as a percentage value, where a higher percentage means that specific area is more important to your scoring.
For example, if your ARG Fairway play tends to drive both good and bad scoring (you score well when it’s good, and poorly when it’s bad), Clippd recognises this resulting in a higher percentage for Importance. Equally, if your ARG Fairway has little impact on your scoring good or bad, Clippd would give this a lower percentage for Importance.
Opportunity - Opportunity is your potential to improve based on your previous ability in that area. A higher percentage means a greater opportunity to improve.
For example, if your OTT Driver is currently 82 for Shot Quality but has previously been 98, your Opportunity to improve would be high as you’ve been at a higher skill level previously.
Trend - Trend looks at whether your Shot Quality is improving or declining in a specific area. A green arrow indicates you are improving, a red arrow shows a decline.
For example, if your PUTT 8-15 ft went from 86 Shot Quality to 90 Shot Quality, you would see a green arrow. Clippd also factors in how much or quickly you are improving or declining in that specific area.
Opening up What To Work On (desktop)
- On desktop, when you open up What To Work On you will see an Importance To Scoring chart top left, which you can click on to filter the list below.
- Below the chart is a scrolling priority list of groups/skills, which are clickable.
- On the right, the supporting information will be shown for your Clippd Default top priority.
- Click on any of the groups/skills on the left to open supporting information for that group/skill.
1. The Importance to Scoring chart matches what is shown in Relative importance on your Scoring dashboard.
2. You can choose to view your overall game in one priority list or filter by OTT, APP, ARG and PUTT, or a selection of any two or three. This means the next time you head to the range, the chipping green or the putting green, you can see how to make the best use of your time.
3. You can choose how to view the priority list, with the option to toggle between Clippd Default, Importance, Opportunity and Shot Quality via the dropdown menu. Clippd Default is the output from our new algorithm that prioritises the parts of the game you should be working on. It ranks the group/skill by a combination of Importance, Trend and Opportunity, with more weight placed on Importance.
4. The left side of the dashboard drives the right part of the screen. When you open What To Work On it will display the Clippd Default list of priorities for your overall game, with your highest priority at the top of the list. In this case, Blair’s number one What To Work On priority is his putting from 8-15ft. Each group/skill is clickable, revealing the supporting information to the right.
Opening up What To Work On (mobile)
- When you open up What To Work On you will see an Importance To Scoring chart, which you can click on to filter the list below.
- Below the chart is a scrolling priority list of groups/skills.
- The items on the list are ordered by Clippd Default, with your highest priority at the top. You can filter how you view the list.
- Click on any group/skill to open up the supporting information.
- Scroll down to see all the data visualisations within the supporting information for each specific part of your game.
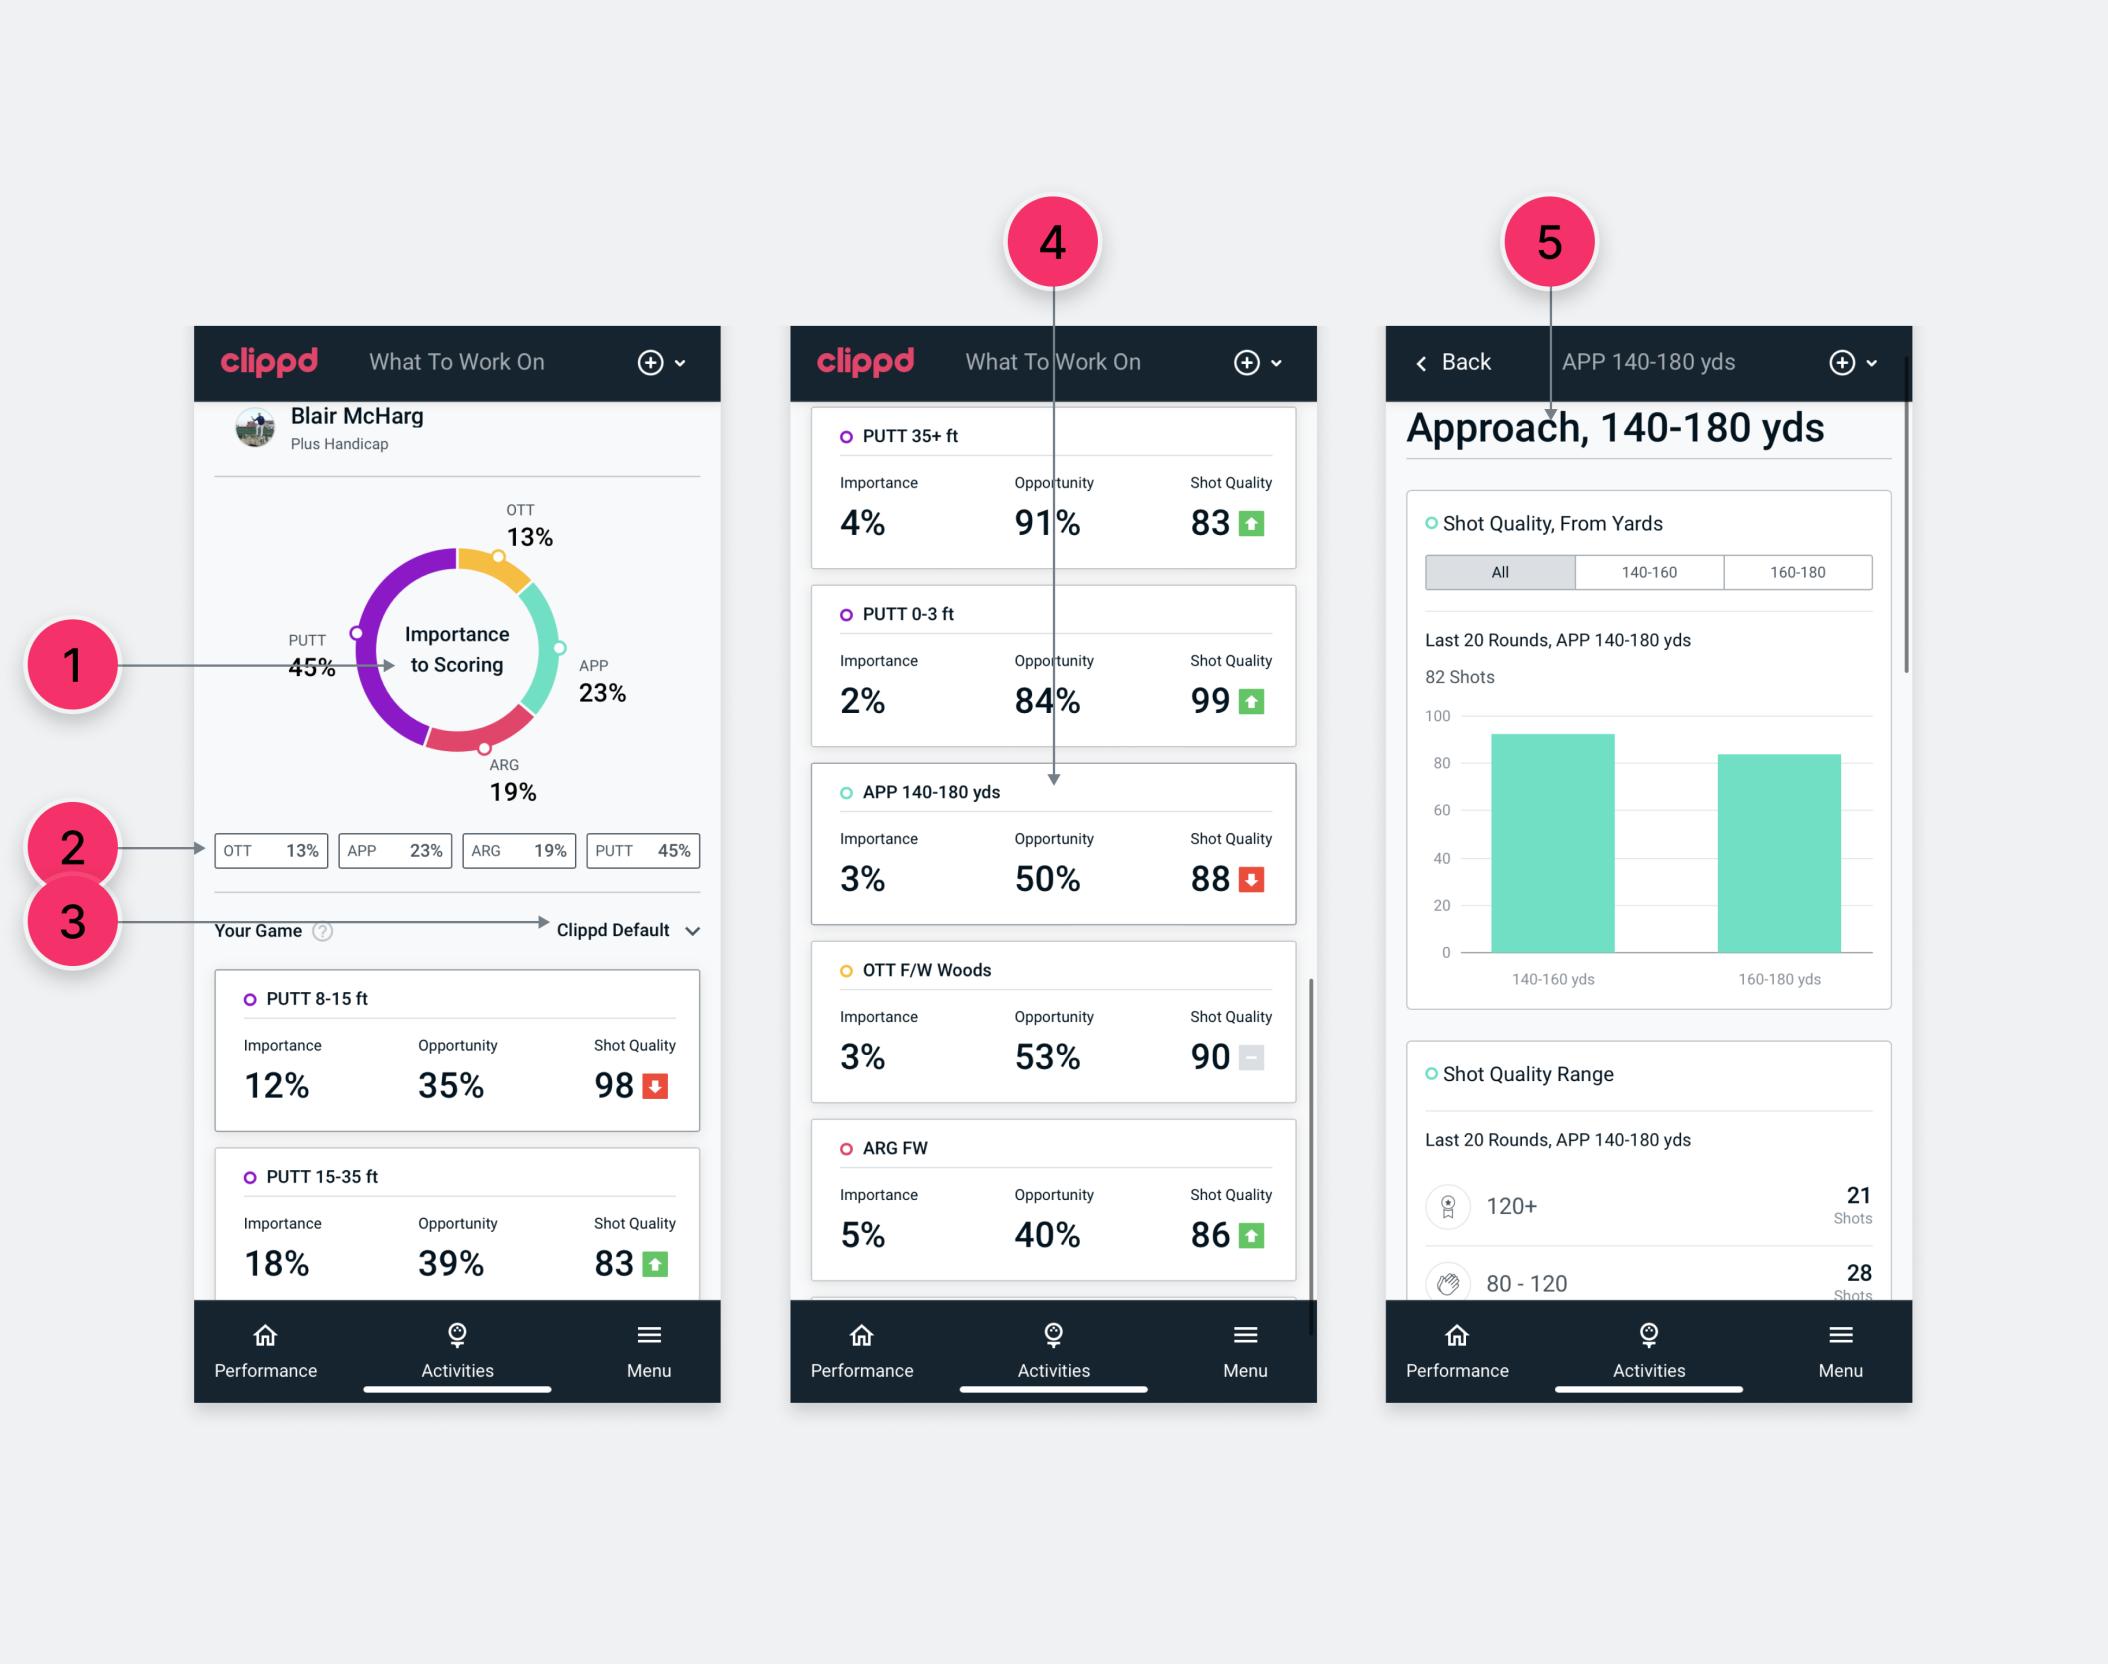
1. The Importance to Scoring chart matches what is shown in Relative importance on your Scoring dashboard.
2. You can choose to view your overall game in one priority list or filter by OTT, APP, ARG and PUTT, or a selection of any two or three.
3. You can choose how to view the priority list, with the option to toggle between Clippd Default, Importance, Opportunity and Shot Quality via the dropdown menu.
4. When you open What To Work On it will display your highest priority at the top of the list. Here, we have scrolled down Blair’s What To Work On list of priorities and selected APP 140-180 yds.
5. You can scroll through the different data visualisations for APP 140-180 yds, choosing how you want to view or filter the information in many cases.
What To Work On – OTT
Groups/skills: The scrolling list is split into OTT Driver, OTT F/W (fairway woods) and OTT Other (irons). We include hybrids as Other.
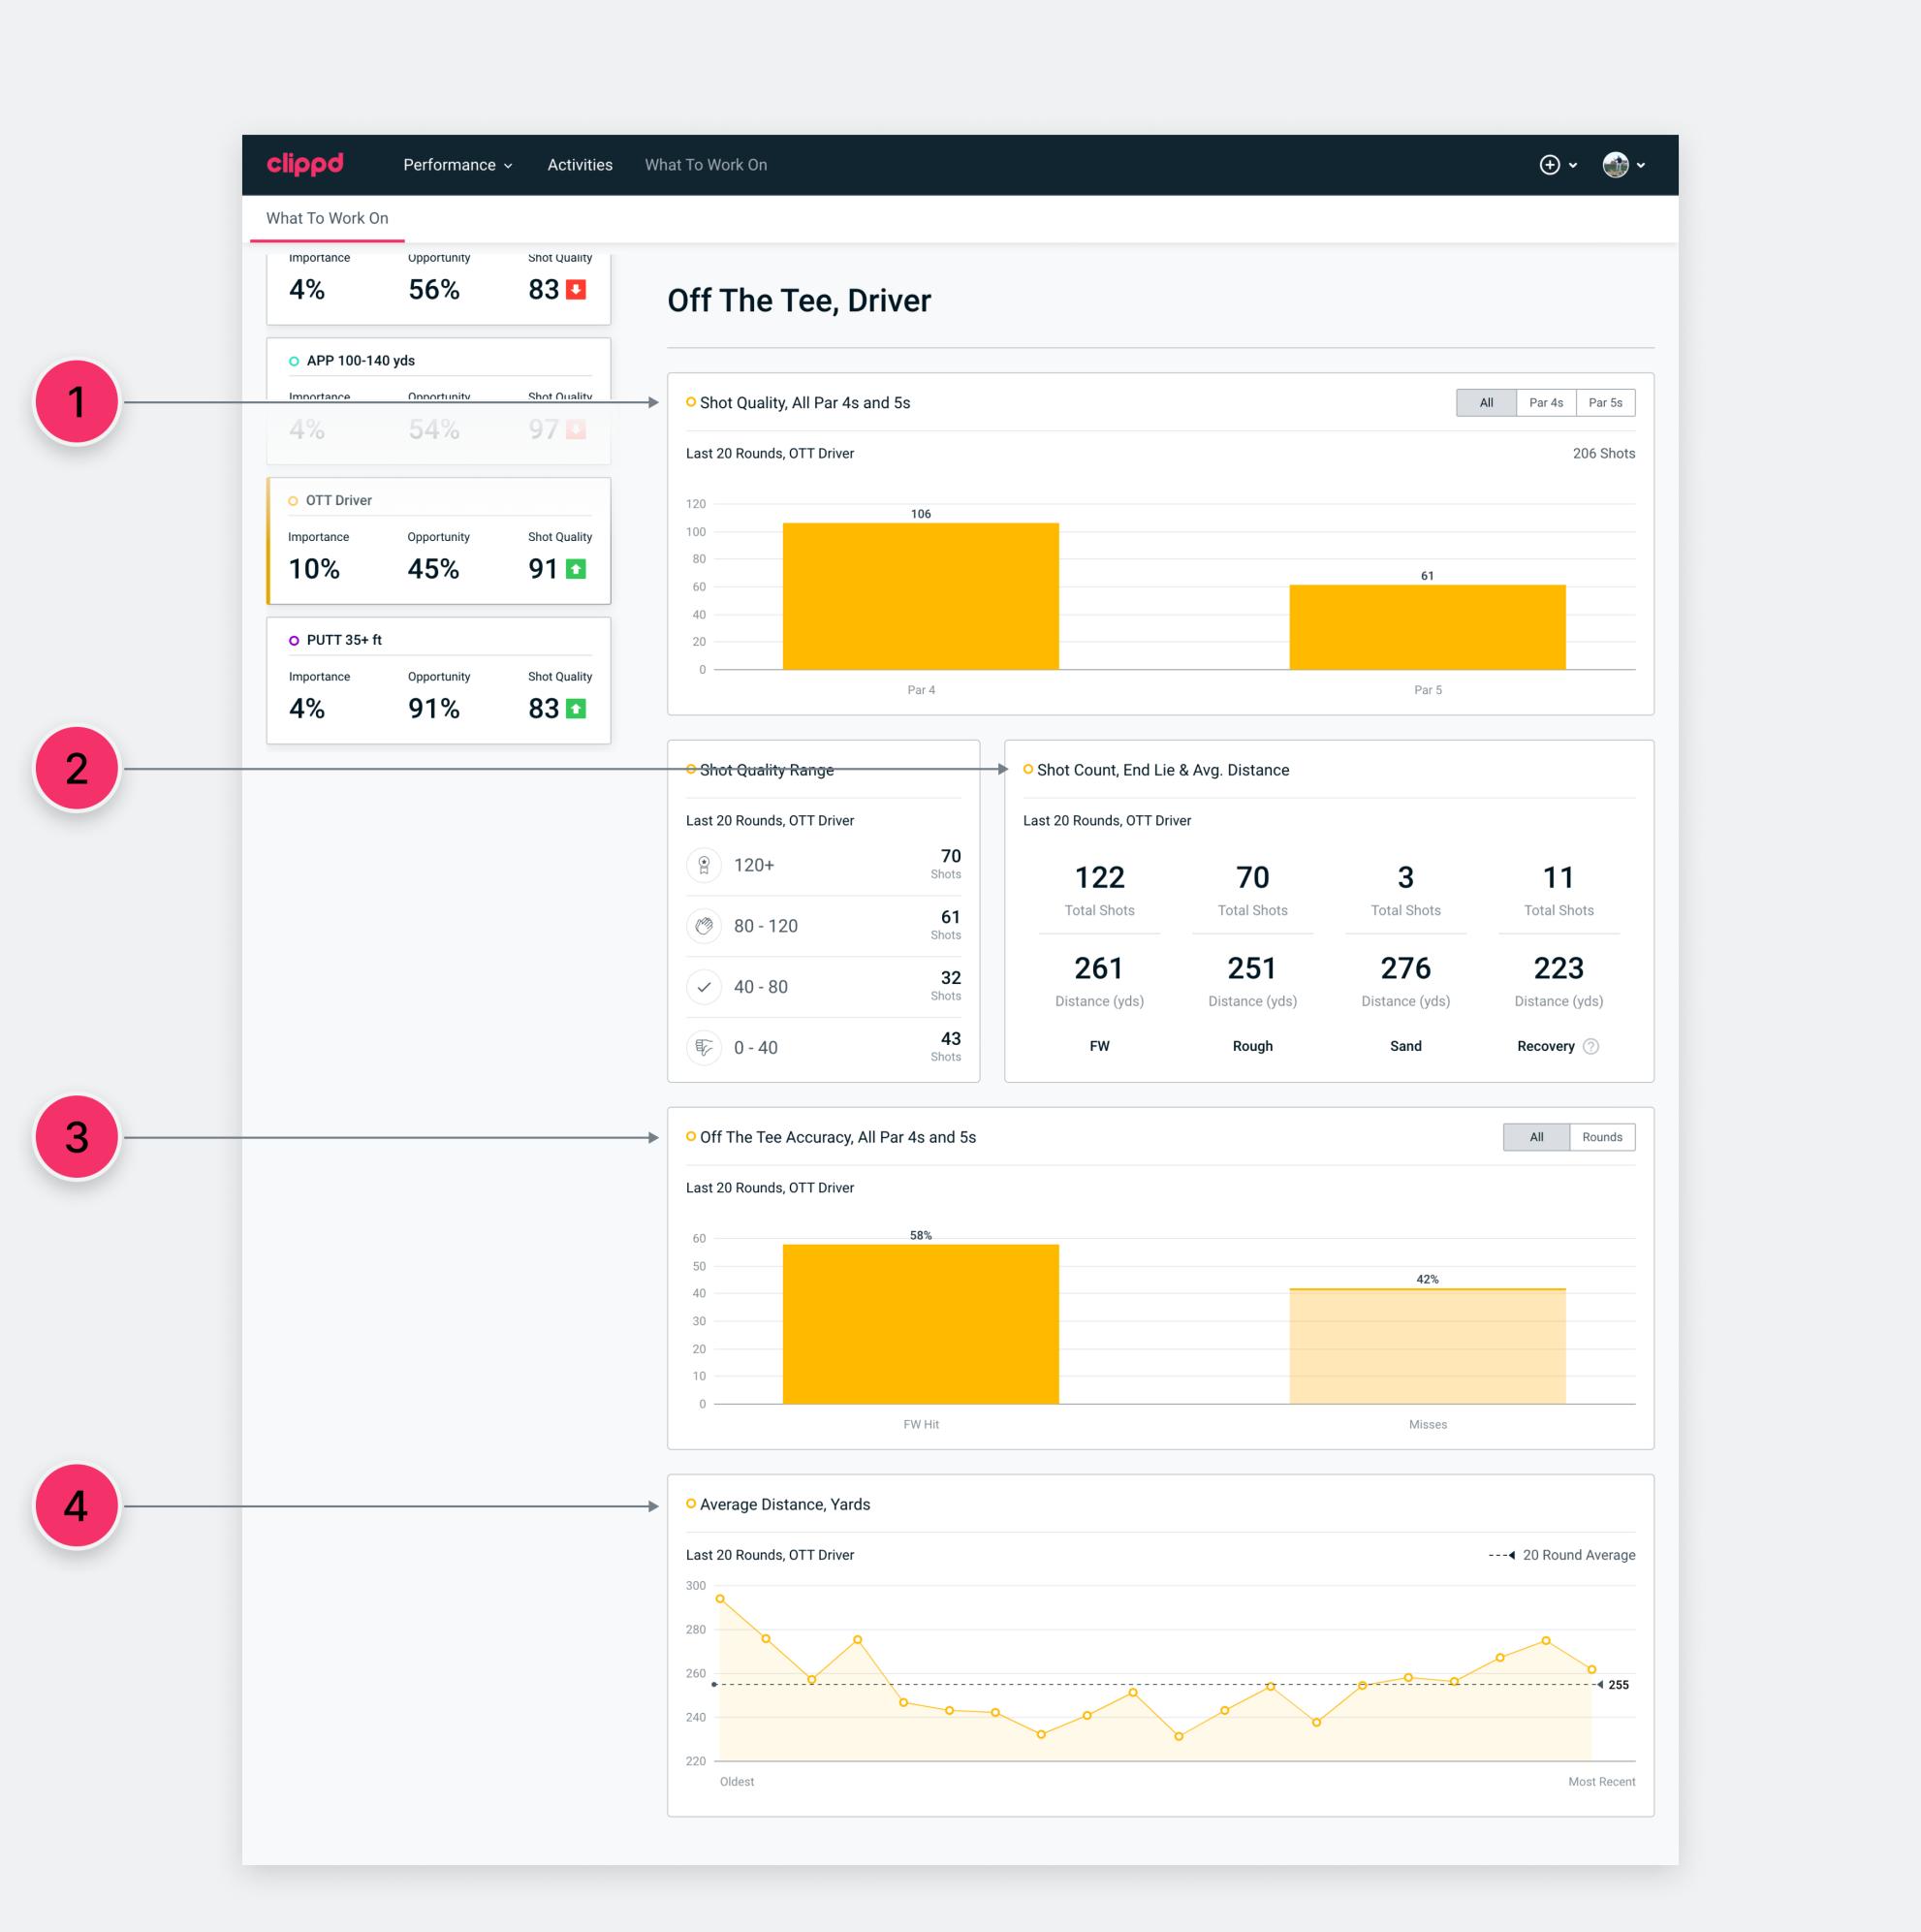
1. Select Pars 4s or Par 5s to see the trend line for your last 20 rounds. Hover on points on the trend line to see the round details or click to access Scorecard, Round Insights and Shot by Shot for individual rounds. The trend line takes into account penalty shots.
2. See how many OTT shots found the fairway, rough, sand or caused you to play a recovery shot. Average distances are shown for each. Shots that led to a Recovery include penalties, so the average distance here might seem low.
3. See your percentage of fairways hit and missed overall. Select Rounds option to view a breakdown of your last 20 rounds. Hover on each bar in the chart to see fairways hit, missed and total number of shots.
4. View the trend line for your Average Distance in yards for the last 20 rounds. Click on each point on the graph to show Average Shot Quality, Average Distance and total number of shots.
What To Work On – APP
Groups/skills: The scrolling list is split into the APP distances – 50-100 yards, 100-140 yards, 140-180 yards, 180+ yards.
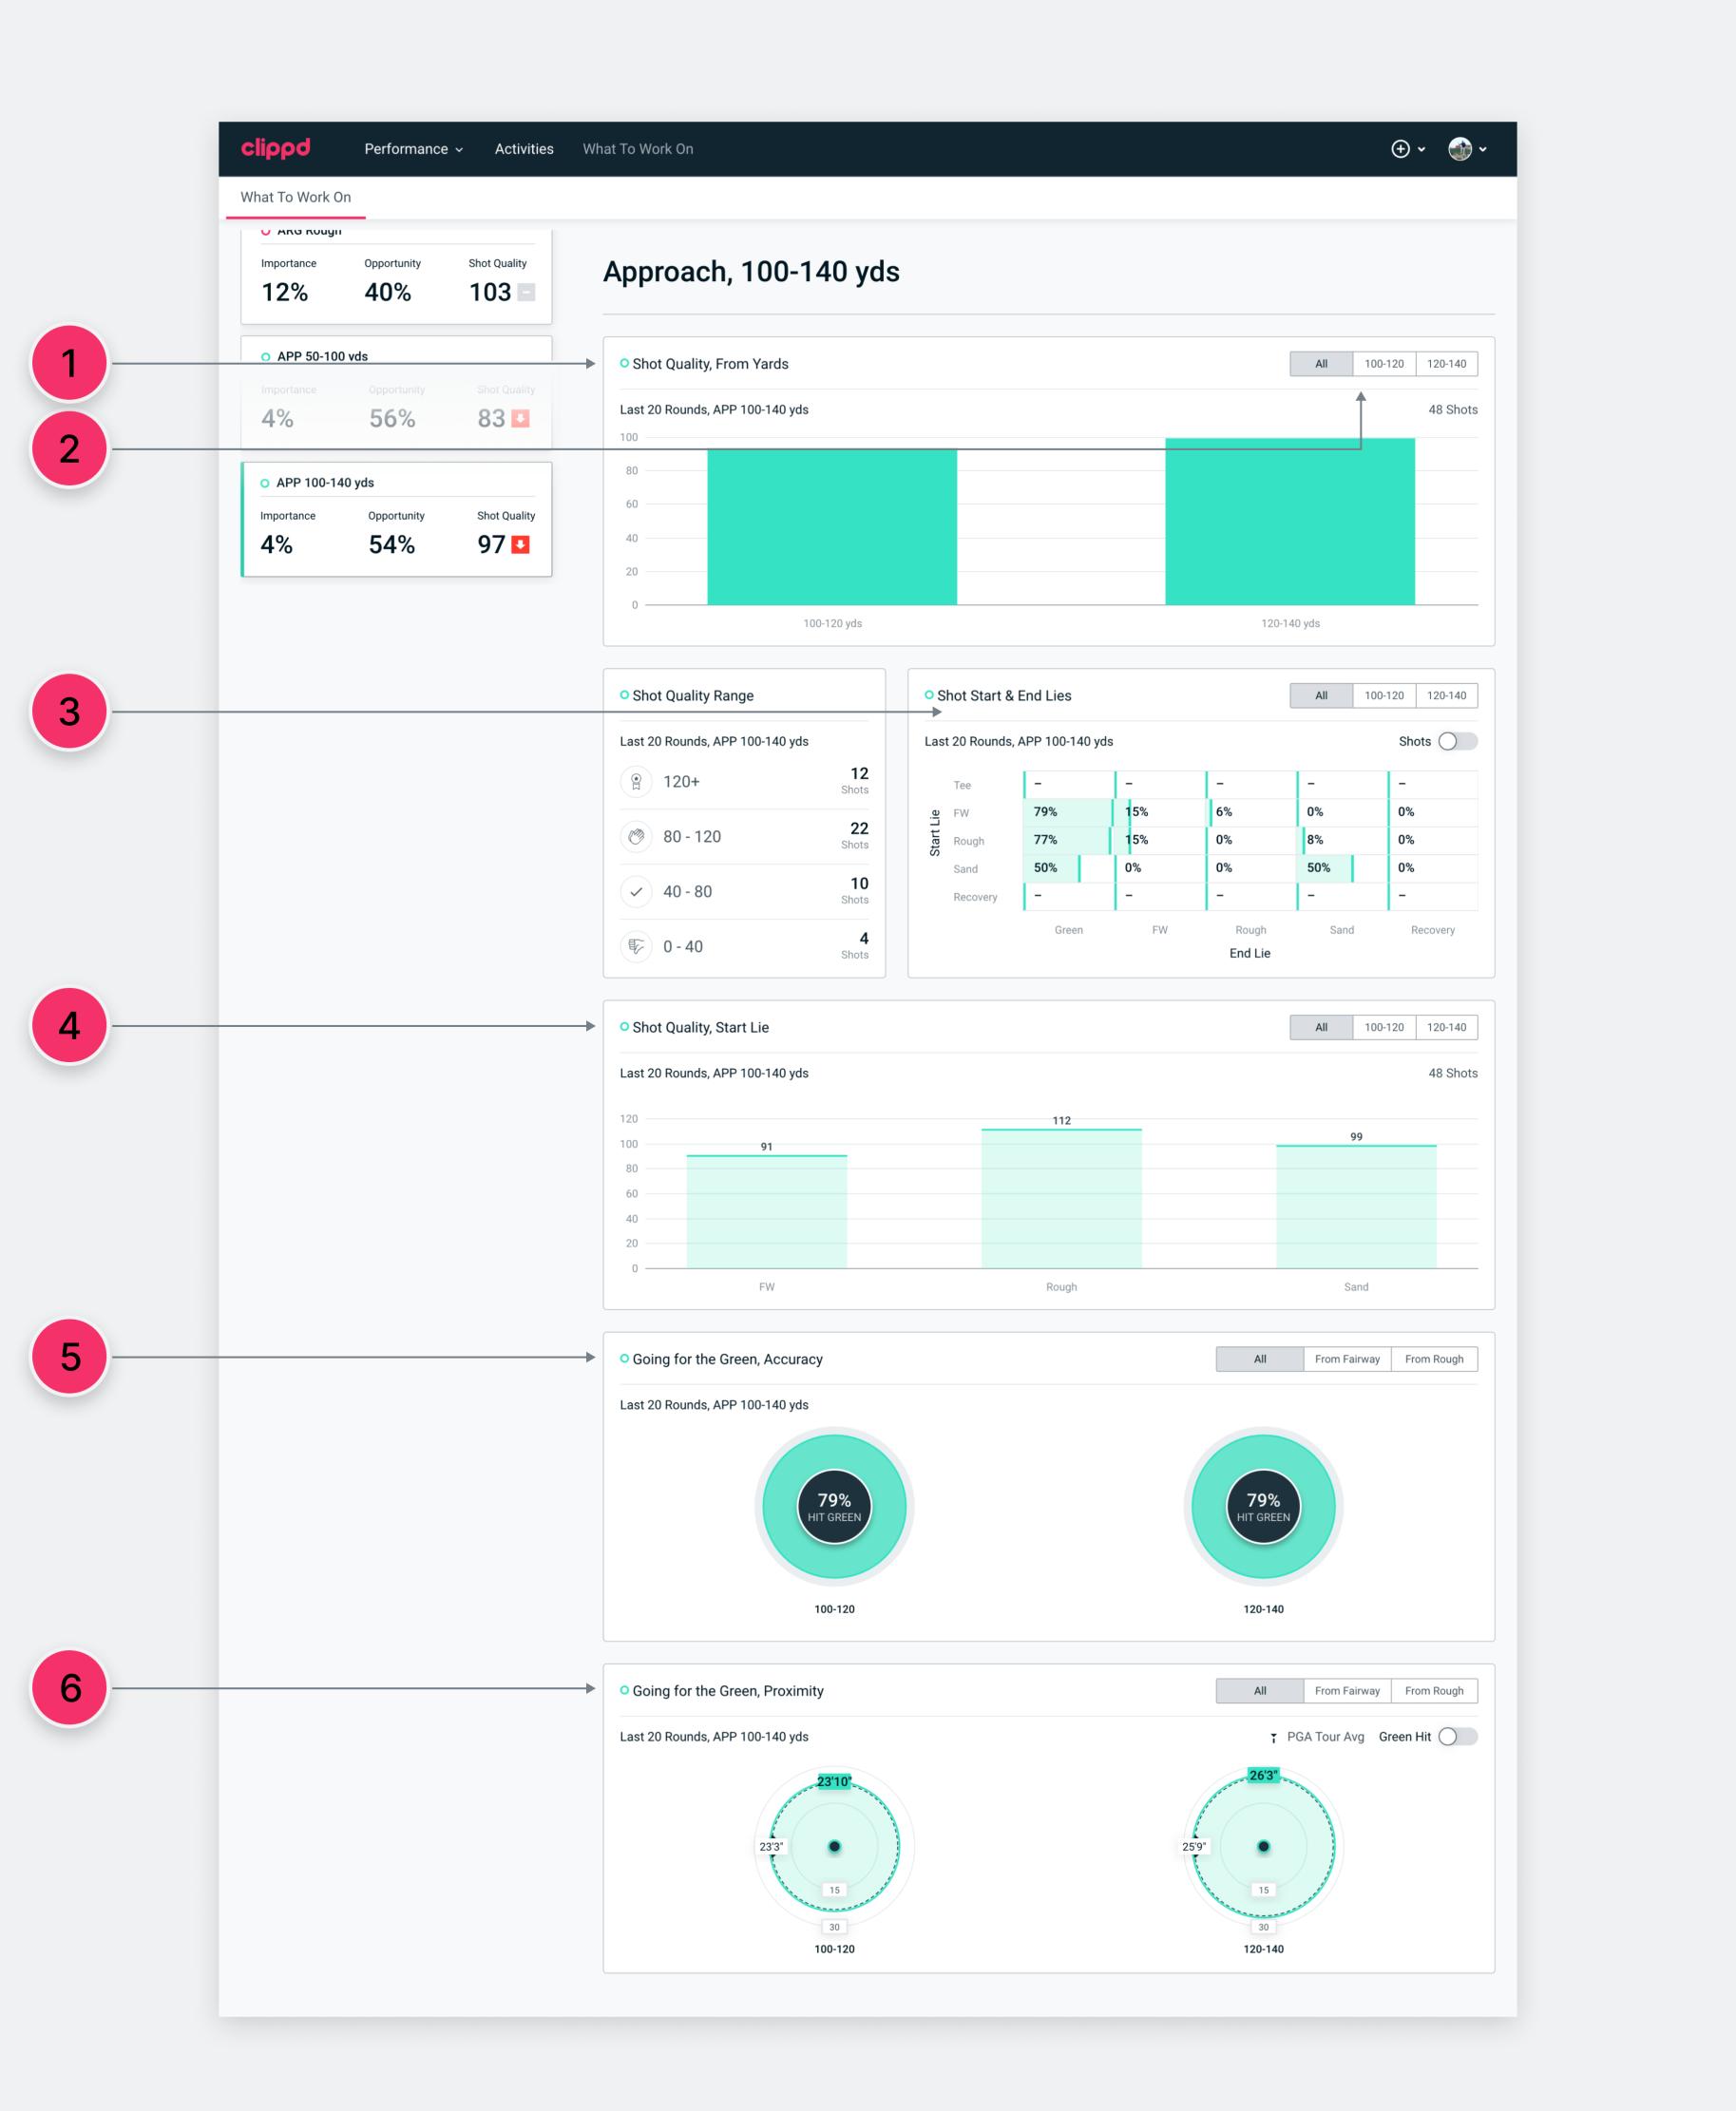
1. Each distance bin is broken down into the same App distance categories shown in your APP DNA. Hover on each bar in the chart to see your Average Shot Quality, Green Hit % and total number of shots at each distance.
2. Select a distance to see your Average Shot Quality trend line and number of shots played over your last 20 rounds. Hover on points on the graph to see more.
3. From different distances and different starting lies, discover how often — in number of shots or as a percentage of shots — you find the green, fairway, rough, sand or a lie that requires a recovery shot.
4. See your Average Shot Quality from different positions on the course at different distances, with the option to break down these yardages still further. Hover over the bars to see how many shots you have played from each start lie.
5. How often do you hit the green when you are deemed to be going for the green? This can be broken down into the different start lies with the green circle denoting percentage.
6. On shots where you are going for the green, how close do you get to the hole? This can be broken down into different start lies. Toggle to see only shots that found the green and only those that missed the green, as well as comparing yourself to the PGA tour average.
What To Work On – ARG
Groups/skills: The scroll bar is split into the three start lies – FW, rough and sand.
1. Average Shot Quality from the three different lies are broken down at different distances. Select a distance bin to see the trend line for Average Shot Quality over the last 20 rounds and number of shots played at each distance. Hover over points on the trend graphs to see more.
2. Shot Count Comparison breaks your ARG shots down into start lies and distances.
3. See how often you finished inside the 6ft conversion zone from different lies and different distances in your last 20 rounds. You can also view your Up & Down % at each distance.
4. Your average proximity to the hole from different distances across the last 20 rounds compared with the PGA tour average.
What To Work On – PUTT
Groups/skills: The scrolling list is split into five distances: 0-3ft, 3-8ft, 8-15ft, 15-35ft, 35ft+.
1. Each sub-group is broken down into smaller distance bins showing Average Shot Quality. Hover over each bar to see the number of putts at each distance and number of putts made. You also have the option to view your 1-Putt% and 3-Putt%.
2. See how many putts you hit at each distance and how many you hole and miss. View the same make and miss rates on putts for birdie or better and on par putts.
3. See your total number of 1, 2 and 3-putts as total number of shots and broken down into smaller distances bins within the sub-group.
We hope you find your What To Work On interesting and useful. If you have a question about any aspect of the feature, simply click 'Reply to Thread' below and we'll respond.
Last edited by Josh; 28-07-23 at 09:05.